ChatGPT chart analysis vs a measured chart scanner
ChatGPT chart analysis works well for explaining a trading chart in plain words. It names patterns and answers follow-up questions. However, it estimates prices by eye, so levels can drift and answers can change between runs. A measured scanner reads each candle from the pixels and returns the same levels every time.
By The Chartloupe team (Product and testing). Last updated .
Side by side
| ChatGPT with an image | Measured chart scanner | |
|---|---|---|
| How it reads the chart | A vision model looks at the whole picture | Finds each candle by color and measures it |
| Price levels | Estimated, often rounded | Clustered from measured swing highs and lows |
| Repeatability | Can change on the next run | Same chart, same numbers |
| Indicators such as RSI and ATR | Read from a visible panel, or guessed | Computed from the detected candles |
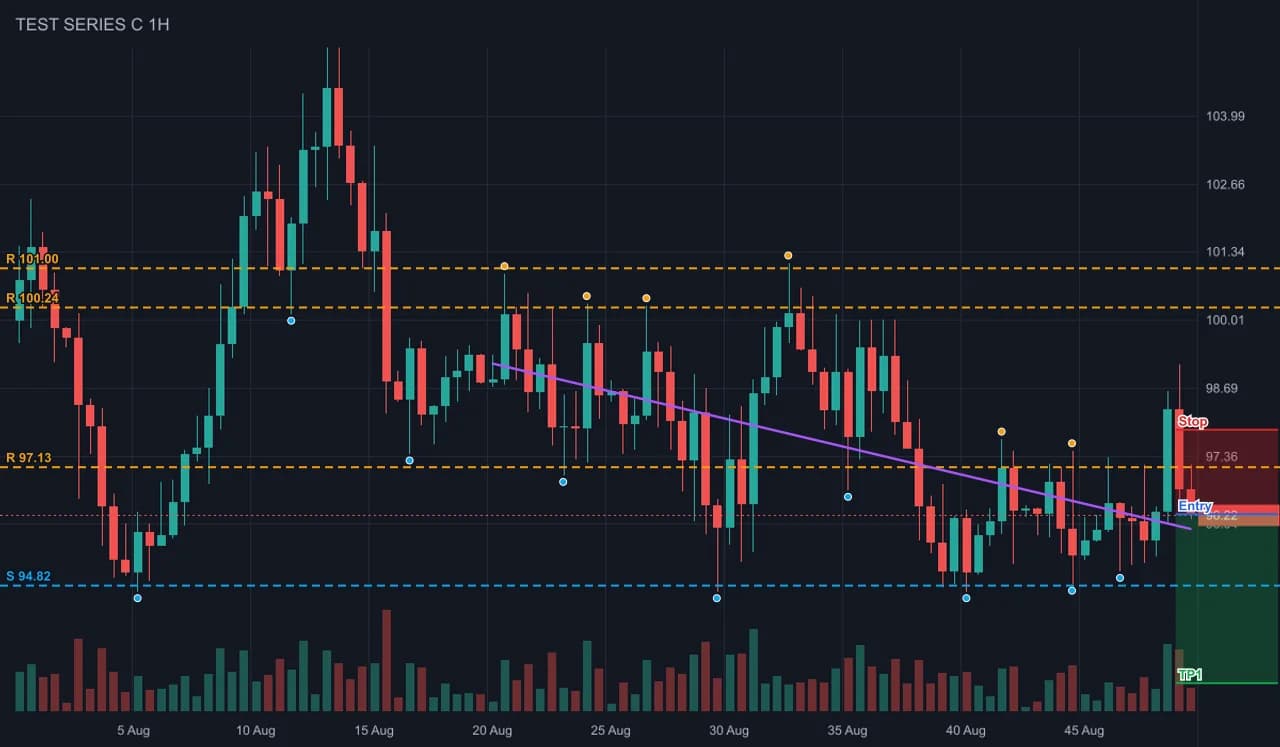
| Output | Text | Annotated PNG plus levels, bias and a setup |
| Follow-up questions | Yes, a strong point | No, but the paid AI read adds a written view |
| Cost | Free tier with limits, paid plans for more | Unlimited free scans, 3 free AI reads a day |
Where ChatGPT chart analysis does well
A chatbot is a patient tutor. You can paste a chart and ask what a hammer candle is, why volume matters, or how a stop works. It also connects the chart to things it knows in general, such as how a stock often moves around earnings. For learning, that is very useful.
It is also flexible. For example, you can ask it to compare two charts or to write a plan in your own words. A scanner with fixed rules cannot do that.
Where a chatbot guesses
The model sees the chart as one picture. So it reads prices the way you would at a glance, by looking at the axis labels and estimating. On a busy chart, a support level can end up several percent away from the real swing lows. Also, the model does not count candles, so an RSI value is only real when the RSI panel is visible and readable.
Answers can also vary. Upload the same screenshot twice and the bias or a target may move. That is normal for a language model, but it makes the numbers hard to trust for a trade plan.
In fact, the OpenAI help center lists these limits itself. It says the model may struggle with graphs that mix solid, dashed and dotted lines, and with tasks that need precise spatial detail. Therefore, treat each price a chatbot gives you as a draft to check.
How the measured scan works
Our scanner removes the grid, the text and the volume panel first. Then it finds each candle body and wick by color and turns them into open, high, low and close values. As a result, every level comes from real swing points, and the tool draws those points on the chart so you can see them.
We test the detector on charts drawn from known price series. On six test charts it found every candle, with a mean close error of 0.08% to 0.15% of the range. The same file always gives the same answer.
Use both, in this order
The two tools fit together well. First, scan the chart to get measured levels, the trend score and a setup with a stop. Then take those numbers to a chatbot and ask it to explain them or to challenge the plan. That way, the words come from a language model while the prices come from measurement.
Our paid AI read works the same way. It sends the image together with our measured numbers, so the written view starts from real levels instead of guesses.
When a chatbot is the better pick
Choose a chatbot when your chart is not a candle chart, such as a line of revenue or a market breadth plot. Also choose it when you mainly want to learn a concept. Our scanner is built for candles and reads the past; it is not financial advice, and neither is a chatbot.
Frequently asked questions
Can ChatGPT do trading chart analysis?
Yes. With image input it can describe the trend, name patterns and explain indicators. However, its price levels are estimates, so check them against the chart.
Is ChatGPT chart analysis accurate?
It is good for concepts and rough structure. For exact levels and stops, a tool that measures candles is more reliable and gives the same result each time.
What prompt should I use for ChatGPT chart analysis?
Give the ticker, the timeframe and the price range on the axis. Then ask for the trend, two support levels, two resistance levels and what would prove the idea wrong.
Why does ChatGPT chart analysis change for the same chart?
Language models sample their answers, so small changes appear between runs. A rules-based scanner has no sampling, which is why its output does not change.
Can I use ChatGPT and a chart scanner together?
Yes. Scan the chart first for measured levels, then paste those numbers into the chat and ask for an explanation or a second opinion.