Bitcoin chart analysis AI with real BTC levels
To get Bitcoin chart analysis with AI, upload a BTC screenshot and type the highest and lowest price on the chart, such as 66,800 and 61,900. The scan then shows the trend, support and resistance in dollars, RSI 14, ATR 14 and a setup with entry, stop and targets. It is free and needs no account.
By The Chartloupe team (Product and testing). Last updated .
PNG, JPG or WebP up to 10 MB. Candlestick or line charts.
Add the price range (optional, gives real prices)
Read the highest and lowest prices touched by the candles on your chart. Without them, levels are shown as a percent of the visible range.
How to analyze a Bitcoin chart with AI, step by step
- Pick a BTC chart on the 15m, 4h or 1D timeframe with at least 30 candles showing.
- Screenshot only the price area, without the order book or trade history panel.
- Upload the picture, then enter the top and bottom price as plain numbers like 66800 and 61900.
- Start the scan and look at how close each level sits to a round number.
- Copy the summary or ask for the AI read to get two written scenarios.
The chart scan is free and unlimited, and the first 3 AI reads each day are free too. For more, see the pricing page for packs and plans, or read how we test the tool.
Bitcoin chart analysis AI tested on a real chart
We drew this test chart from a price series we know bar by bar, then ran it through this exact analyzer. So the error below is measured against the true prices, not estimated.
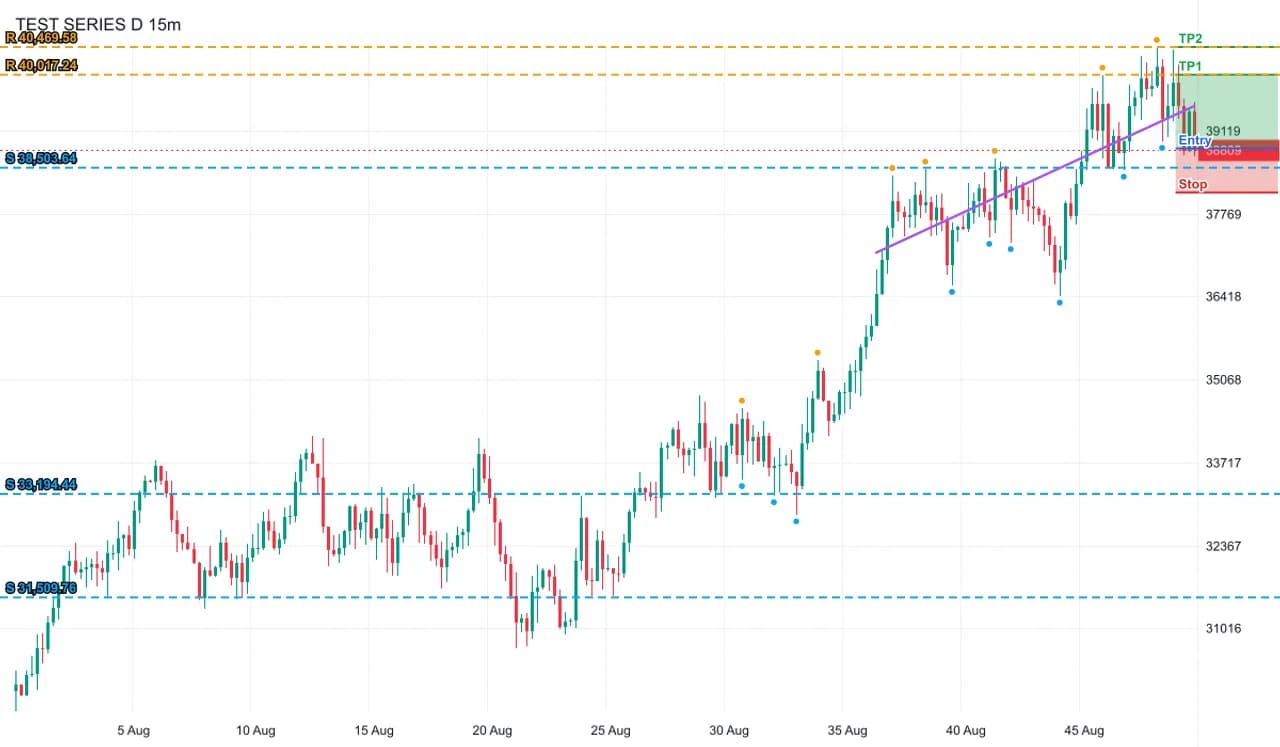
- Test input
- crypto-dense-light.png (220 dense bars at crypto-like prices, light theme, drawn from a known price series)
- Output
- Annotated chart with levels, swings and setup
- Bars in the series
- 220
- Bars detected
- 220
- Mean close error
- 0.08% of range
- Worst close error
- 0.36% of range
- Bias
- bullish (+3 of 4 checks)
- RSI 14
- 48.1
- Levels found
- 5
- Setup
- long, reward to risk 1.7
- Confidence
- 75 of 100
- Annotated PNG size
- 50 KB
- Processing time
- 0.01 s
How we test: every page uses a chart from a known series, and we compare the detected bars with the true ones. More on the about page.
Bitcoin chart analysis AI in real dollar prices
Without prices, the scan shows each level as a percent of the visible range. That is fine for shape, but Bitcoin traders think in dollars. So type the highest and lowest price you see on the chart before you run it. Plain numbers work best, for example 66800 and 61900, with no dollar sign or comma needed.
Then every level becomes a real price. For instance, a support could read 64,250 and a resistance 65,900. Next, you can put an alert at that exact number in your exchange app. The stop and the targets use the same scale, so the whole plan is ready to copy.
Keep in mind that the scan does not read the axis text. Because of that, the two numbers you type must match the highest wick and the lowest wick in the image, not the axis labels above or below them.
Round numbers and BTC support and resistance
Bitcoin reacts to round numbers more than most assets. Levels like 60,000, 65,000 and 70,000 attract large orders, and so do the 500 and 1,000 steps in between. As a result, swing highs and lows often cluster near them.
The scan finds levels from pivots, not from round numbers. However, when a measured level lands at 64,950, it is fair to treat 65,000 as the real zone. In contrast, a level far from any round figure is often an older swing that fewer traders watch.
Also, each level shows its strength. One touch is weak, two is moderate, and three or more is strong. So a strong level near a round number deserves the most attention on a BTC chart.
Timeframes for Bitcoin chart analysis with AI: 15m, 4h or 1D
The 15-minute chart suits day trades. It shows about two days in 200 candles, but noise is high, so expect more neutral readings. The 4-hour chart is a middle ground, because 200 bars cover roughly a month of BTC trading. The daily chart covers most of a year and shows the levels that funds watch.
Therefore, a simple routine is to scan the daily first, then the 4-hour, then the 15-minute. If all three lean the same way, the bias is clearer. If they disagree, the higher timeframe usually matters more. Targets follow the same levels: the setup picks the next support or resistance at least one risk unit (1R) away from entry. If none exists, target 1 is 2R and target 2 is one more R beyond it.
When a BTC scan is not enough
A Bitcoin screenshot hides a lot. For example, it has no ETF flows, no funding rate, no options expiry and no macro calendar. A rate decision or a big exchange event can move BTC 5 percent in an hour, and no chart pattern will warn you first.
Also, a line chart gives weaker results, because it has no candle patterns and no wicks. Finally, this is an educational tool, not financial advice. Size each trade so a stop costs you only a small part of your account.
Bitcoin chart analysis AI at a glance
| BTC detail | What the scan does |
|---|---|
| Real prices | type the chart high and low (e.g. 66800 and 61900) to get dollar levels |
| Round numbers | levels near 60,000 or 65,000 are measured from pivots, then easy to match |
| 15m chart | about two days of bars, more noise, good for intraday plans |
| 4h chart | about a month of bars, a balance of detail and signal |
| 1D chart | most of a year, the levels most BTC traders watch |
| Targets | next level at least 1R from entry, or 2R and 3R if none |
Bitcoin chart analysis AI FAQ
Can AI analyze a Bitcoin chart?
Yes. Upload a BTC screenshot and the scan reads the candles, then reports the trend, levels, RSI, ATR and a setup. Add the chart high and low to see those levels in dollars.
What is the best timeframe for Bitcoin chart analysis?
The 4-hour chart is a good default for BTC. Use the daily chart for the bigger picture and the 15-minute chart for intraday entries.
How do I get Bitcoin levels in real prices?
Type the highest and lowest price on the chart before you scan, like 66800 and 61900. Every level, stop and target then shows as a dollar price.
Is the Bitcoin chart analyzer free?
Yes. The scan is free and unlimited with no account. The written AI read has three free runs per day.
Does it read the BTC price axis automatically?
No, it does not read axis text yet. That is why you type the high and low; otherwise, levels show as a percent of the visible range.