Support and resistance chart from your screenshot
To get a support and resistance chart, upload a screenshot of any candlestick chart. The tool finds the swing highs and lows, groups the ones that line up, and draws up to three levels above and three below the price. Each line shows its touches and strength, so you can see which zones matter most.
By The Chartloupe team (Product and testing). Last updated .
PNG, JPG or WebP up to 10 MB. Candlestick or line charts.
Add the price range (optional, gives real prices)
Read the highest and lowest prices touched by the candles on your chart. Without them, levels are shown as a percent of the visible range.
How to draw a support and resistance chart from a screenshot, step by step
- Open the market you follow and capture a screenshot with at least 30 visible candles.
- Drop, paste or pick the image in the upload box on this page.
- Add the top and bottom price of the chart if you want levels in real prices.
- Run the scan and look at the lines drawn above and below the last candle.
- Check the touch count on each line, then save the marked up PNG for your notes.
The chart scan is free and unlimited, and the first 3 AI reads each day are free too. For more, see the pricing page for packs and plans, or read how we test the tool.
Support and resistance chart tested on a real chart
We drew this test chart from a price series we know bar by bar, then ran it through this exact analyzer. So the error below is measured against the true prices, not estimated.
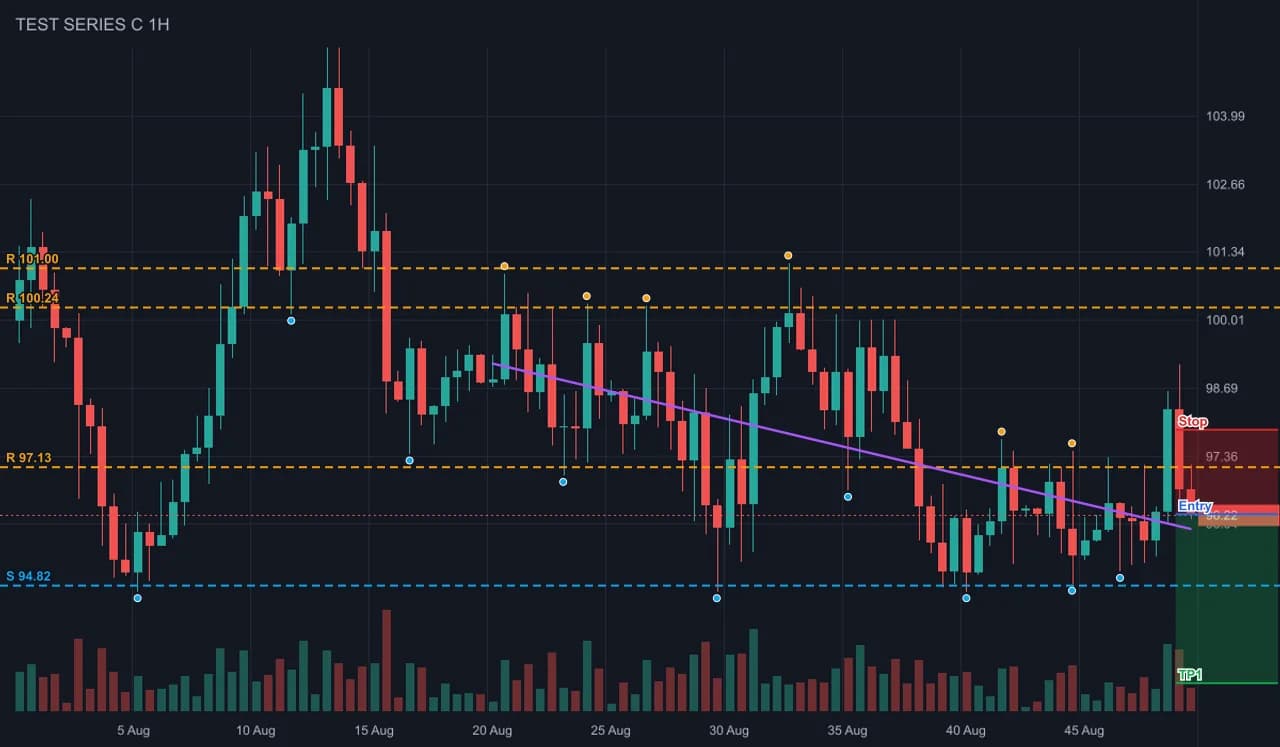
- Test input
- range-dark.png (a sideways range between two levels, dark theme, drawn from a known price series)
- Output
- Annotated chart with levels, swings and setup
- Bars in the series
- 100
- Bars detected
- 100
- Mean close error
- 0.10% of range
- Worst close error
- 0.27% of range
- Bias
- bearish (-3 of 4 checks)
- RSI 14
- 47.5
- Levels found
- 4
- Setup
- short, reward to risk 2
- Confidence
- 75 of 100
- Annotated PNG size
- 46 KB
- Processing time
- 0.01 s
How we test: every page uses a chart from a known series, and we compare the detected bars with the true ones. More on the about page.
What a support and resistance chart shows
Support is a price zone where falling prices have stopped before. Resistance is the mirror idea: a zone where rising prices have stalled. Both come from memory. Traders remember where buyers stepped in, so they often act there again.
A good chart of these zones is not a pile of random lines. Instead, it shows a few levels that price has actually respected. For example, a stock that bounced at 48 dollars three times in two months has a clear floor. In contrast, a single spike to 55 dollars a year ago tells you much less.
So the goal is simple. You want to see the handful of prices where the next reaction is most likely, and you want to know how much weight each one deserves.
How the tool draws each line on your chart
First, the scan reads every candle from the pixels of your screenshot and turns it into open, high, low and close values. Next, it marks swing highs and swing lows, which are bars that stand above or below their neighbors. Then it groups swings that sit at almost the same price into one zone.
After that, each zone is ranked by how many times price touched it and how recent those touches are. The top three above the last price become resistance, and the top three below become support. Finally, the lines are drawn straight onto your own image, together with dots on the swings that built them.
Because the rules are fixed, the same screenshot always gives the same lines. As a result, you can check every level by eye instead of trusting a black box.
Touches, strength and role reversal
Every level carries a strength label. One touch is weak, two touches are moderate, and three or more are strong. For instance, a support line hit on three separate dips is labeled strong, while a line built from one swing low is only a hint.
Role reversal is the other idea worth knowing. When price breaks through resistance and holds above it, that old ceiling often turns into a new floor. The same thing happens in reverse after support breaks. Therefore, a level on your support and resistance chart can flip sides as the market moves, and the tool simply labels it by where it sits against the last price.
Also, keep in mind that a level is a zone, not a single tick. Price often pokes a little past it before turning, so leave room around every line.
When this is not the right tool
A screenshot only holds the bars you can see. So if a key level sits outside the visible window, the scan cannot find it. Also, charts packed with drawings, many indicators or Heikin Ashi candles can confuse the detector, and the page warns you when it finds fewer than 30 bars.
Next, the tool does not read order books, volume profile or news. Those can move price straight through a strong line. Above all, this is an educational tool and not financial advice, so treat each level as a starting point for your own plan.
How levels are shown on the chart
| Item | What you see |
|---|---|
| Levels per side | up to 3 resistance lines above and 3 support lines below the last price |
| Weak | 1 touch at the level |
| Moderate | 2 touches at the level |
| Strong | 3 or more touches at the level |
| Units | real prices if you type the chart high and low, otherwise % of the visible range |
| Output | annotated PNG with lines, swing dots and a trend line |
Support and resistance chart FAQ
How do you draw support and resistance on a chart?
Mark the swing highs and lows, then draw lines where several of them line up. This tool does it for you from a screenshot and shows the touch count for each line.
What is a strong support level?
It is a price where the market has turned up three or more times. Here, a level with three or more touches is labeled strong.
What is role reversal in support and resistance?
It is when broken resistance becomes support, or broken support becomes resistance. Traders watch for a retest of the old level from the other side.
Is there a free support and resistance indicator for screenshots?
Yes. The scan on this page is free and unlimited, with no account needed. You get the levels drawn on your own image.
Does it work on crypto and forex charts?
Yes. It works on any candlestick chart with green and red candles, in light or dark themes. That includes stocks, crypto, forex and futures.