Support and resistance levels, found by a clear rule
To find support and resistance levels on a chart, upload a candlestick screenshot. The scan marks pivot highs and lows, merges pivots that sit within a small tolerance, and ranks each zone by touches and recency. You then get up to three levels on each side of price, ready to use for stops and targets.
By The Chartloupe team (Product and testing). Last updated .
PNG, JPG or WebP up to 10 MB. Candlestick or line charts.
Add the price range (optional, gives real prices)
Read the highest and lowest prices touched by the candles on your chart. Without them, levels are shown as a percent of the visible range.
How to find support and resistance levels with the scan, step by step
- Pick a chart window that shows at least 30 candles and a few clear turns.
- Upload the screenshot, or paste it straight from your clipboard.
- Enter the highest and lowest visible price so each level reads in real money.
- Start the scan and read the level list with touch counts and strength.
- Place your stop beyond the nearest level, not exactly on it.
The chart scan is free and unlimited, and the first 3 AI reads each day are free too. For more, see the pricing page for packs and plans, or read how we test the tool.
Support and resistance levels tested on a real chart
We drew this test chart from a price series we know bar by bar, then ran it through this exact analyzer. So the error below is measured against the true prices, not estimated.
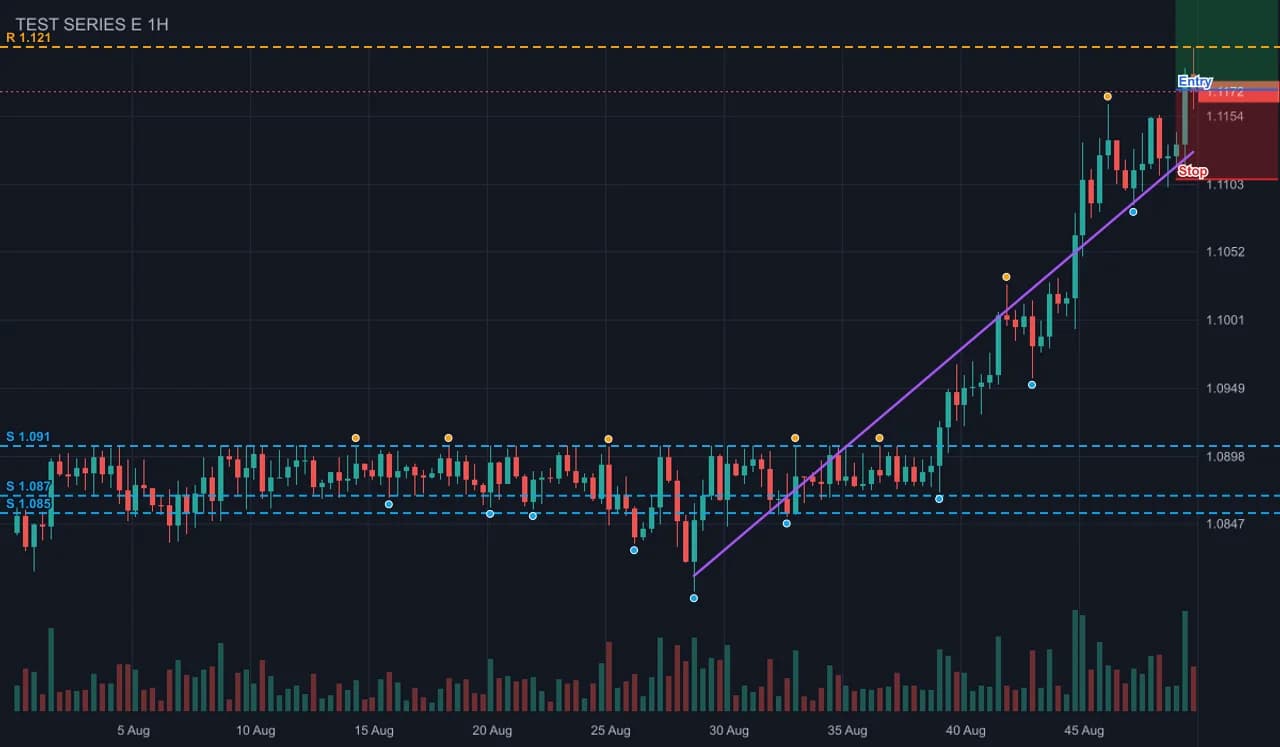
- Test input
- forex-range-breakout-dark.png (a forex-like range that breaks higher, dark theme, drawn from a known price series)
- Output
- Annotated chart with levels, swings and setup
- Bars in the series
- 140
- Bars detected
- 140
- Mean close error
- 0.10% of range
- Worst close error
- 0.26% of range
- Bias
- bullish (+4 of 4 checks)
- RSI 14
- 70.6
- Levels found
- 4
- Setup
- long, reward to risk 2
- Confidence
- 84 of 100
- Annotated PNG size
- 45 KB
- Processing time
- 0.01 s
How we test: every page uses a chart from a known series, and we compare the detected bars with the true ones. More on the about page.
Step one: finding pivots
Everything starts with pivots. A pivot high is a bar whose high sits above the highs of the bars around it. In our scan, that means two to three bars on each side. A pivot low works the same way with lows. So a single tall wick in a choppy stretch does not count unless its neighbors are lower.
Why two to three bars? Because one bar on each side marks almost every wiggle, and the chart fills with noise. On the other hand, five or more bars on each side misses fresh turns near the right edge. The short window keeps recent swings in play while still ignoring tiny zigzags.
Step two: the tolerance rule for support and resistance levels
Next, pivots that sit close together are merged into one zone. Close means within a tolerance of 1.2 percent of the visible price range or 0.35 of the average true range, whichever is larger. The ATR part matters on volatile charts, where bars are wide and exact matches are rare.
Here is a worked example. Say the chart spans 100 dollars from bottom to top, so 1.2 percent is 1.20 dollars. The 14 bar ATR is 2.00 dollars, so 0.35 ATR is 0.70 dollars. As a result, the tolerance is 1.20 dollars. Therefore, swing lows at 51.10, 51.60 and 52.00 all fall into one zone with three touches.
Finally, each zone is ranked by its number of touches plus how recent they are. The top three above the last price become resistance, and the top three below become support. In contrast, a zone with one old touch usually drops off the list.
Using support and resistance levels for stops
A level is where you expect a reaction, so a stop placed exactly on it is often hit by a normal poke. Instead, put the stop beyond the level with a buffer. Our setup rule uses the nearest level plus half an ATR. For example, with support at 51.50 dollars and an ATR of 2.00 dollars, a long stop goes at 50.50 dollars.
If no level sits near the price, the rule falls back to 1.5 ATR from entry. Also, favor strong levels with three or more touches for stops. A weak level with one touch gives you less reason to expect a bounce, so it is a thinner shield for your risk.
When this method is the wrong choice
This method sees only the candles in your screenshot. So a big level from a weekly chart will not appear on a five minute view. Also, the tool does not read the price axis text, which is why levels show as a percent of the range until you type the high and low.
Next, news and thin markets can break any zone without warning. Heavy drawings or Heikin Ashi candles can also confuse the detector, and the page warns you below 30 bars. Above all, this is education, not financial advice.
Level detection parameters
| Parameter | Value |
|---|---|
| Pivot window | 2 to 3 bars on each side of the swing bar |
| Merge tolerance | max(1.2% of visible range, 0.35 x ATR 14) |
| Ranking | touch count plus recency of the touches |
| Levels kept | up to 3 above and 3 below the last price |
| Strength labels | weak 1 touch, moderate 2, strong 3 or more |
| Stop buffer | nearest level plus 0.5 ATR, or 1.5 ATR when no level is near |
Support and resistance levels FAQ
How do you identify support and resistance levels?
Mark swing highs and lows, then group the ones that sit at nearly the same price. The more touches a group has, the more weight it carries.
How many touches make a strong level?
Three or more touches make a strong level in our scan. Two touches are moderate, and one touch is weak.
Where should I put a stop loss near support?
Put it below the support zone with a buffer, not right on the line. Our rule uses half an ATR beyond the nearest level.
What timeframe is best for support and resistance?
Higher timeframes give fewer but sturdier levels. Many traders mark daily or weekly zones first and then refine entries on a shorter chart.
Why are my levels shown as percentages?
The tool does not read axis text. Type the highest and lowest price on the chart, and every level turns into a real price.