Free AI chart analysis, no signup needed
To get a free AI chart analysis, upload a screenshot of any candlestick chart and press Analyze. There is no account, no card and no scan limit. In under a second you see the trend, support and resistance, patterns, RSI and a trade setup drawn on your own image.
By The Chartloupe team (Product and testing). Last updated .
PNG, JPG or WebP up to 10 MB. Candlestick or line charts.
Add the price range (optional, gives real prices)
Read the highest and lowest prices touched by the candles on your chart. Without them, levels are shown as a percent of the visible range.
How to run a free AI chart analysis, step by step
- Open the chart you want to check and capture it as a PNG, JPG or WebP file.
- Paste the image into the box with Ctrl+V, or drag it in from your desktop.
- Add the top and bottom price of the chart if you want levels in real prices.
- Click Analyze chart and wait less than a second for the result.
- Save the annotated PNG or copy the text summary into your trading notes.
The chart scan is free and unlimited, and the first 3 AI reads each day are free too. For more, see the pricing page for packs and plans, or read how we test the tool.
Free AI chart analysis tested on a real chart
We drew this test chart from a price series we know bar by bar, then ran it through this exact analyzer. So the error below is measured against the true prices, not estimated.
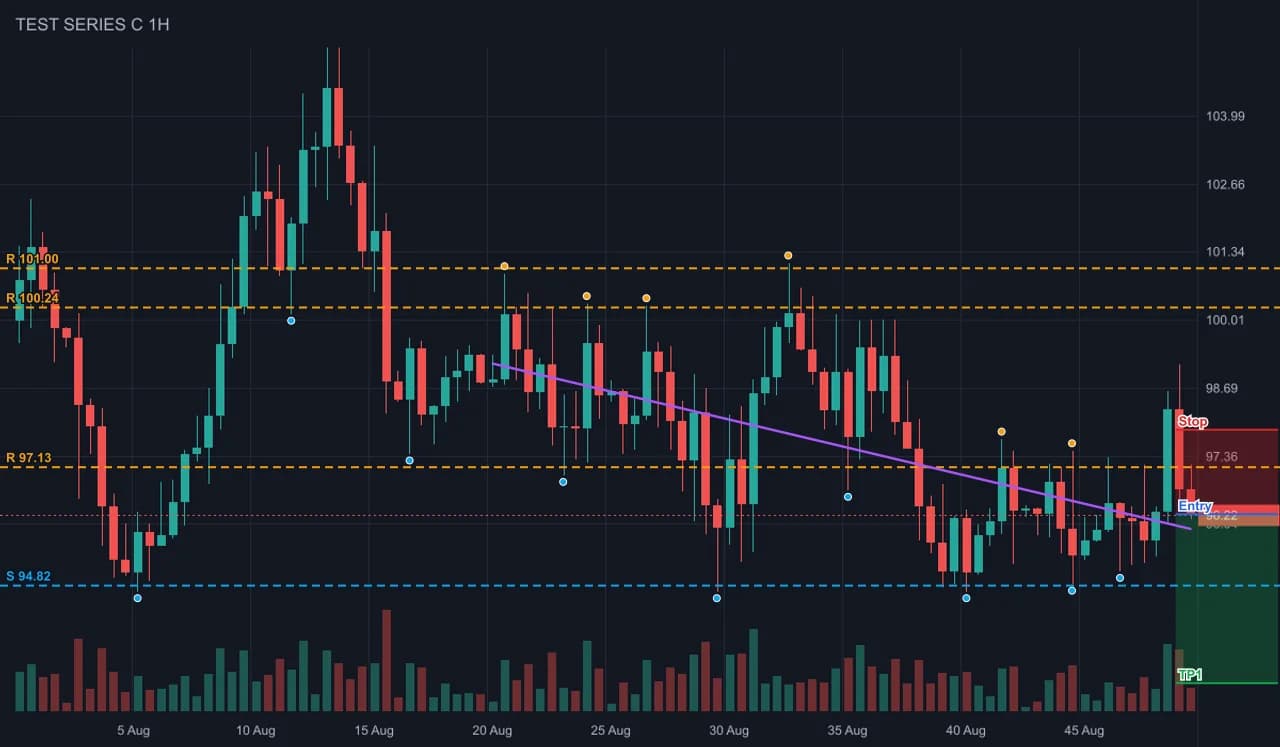
- Test input
- range-dark.png (a sideways range between two levels, dark theme, drawn from a known price series)
- Output
- Annotated chart with levels, swings and setup
- Bars in the series
- 100
- Bars detected
- 100
- Mean close error
- 0.10% of range
- Worst close error
- 0.27% of range
- Bias
- bearish (-3 of 4 checks)
- RSI 14
- 47.5
- Levels found
- 4
- Setup
- short, reward to risk 2
- Confidence
- 75 of 100
- Annotated PNG size
- 46 KB
- Processing time
- 0.04 s
How we test: every page uses a chart from a known series, and we compare the detected bars with the true ones. More on the about page.
What is free and what is paid
First, the chart scan is free, and it stays free. You can run it as often as you like, with no account and no email. It finds the candles, measures the trend with four checks, marks up to three levels above and three below price, flags patterns, and builds a setup. So every number on the result page comes from the free scan.
The paid part is the AI read. It sends your image and our measured numbers to a vision model, which writes context, indicator notes, two scenarios and the main risks. You get three AI reads free each day. After that, credits or a plan add more, and the prices are on the pricing page.
In short, you pay only for the written explanation. The levels, the bias and the setup never sit behind a paywall.
How free chart tools usually lock things, and how this one does not
Many free tools follow the same pattern. For example, they give you two or three scans, then ask for an email. Others show the trend but blur the levels, or hide the stop and targets until you upgrade. As a result, the free tier becomes a demo rather than a tool.
Our scan works differently, because it does not call an AI model at all. Instead, the server reads the candles from the pixels with fixed rules, which costs almost nothing to run. That is why we can keep it unlimited. A typical chart takes 12 to 55 milliseconds, so there is no queue to ration either.
Also, the same chart always gives the same answer. Therefore you can rerun a screenshot tomorrow and compare the levels without wondering if a model changed its mind.
Limits of a free AI chart analysis
Some limits are technical, not commercial. The file must be a PNG, JPG or WebP image of 10 MB or less. Next, the detector needs colored candles, so a line chart falls back to a line tracer and skips candle patterns. Finally, it warns you when it finds fewer than 30 bars, because short charts give weak levels.
The scan does not read axis text either. So if you want levels in dollars or pips, type the highest and lowest price shown. Otherwise, the levels appear as a percent of the visible range. Your screenshot stays in memory only and is never stored.
When a free scan is not the right choice
A screenshot is a snapshot, not a data feed. For instance, it has no order book, no news and no live updates. If you trade on the one minute chart and need alerts, a charting platform with live data suits you better.
Also, the confidence score runs from 5 to 90 and measures how well the checks agree. It is not a win rate. This page is for learning and is not financial advice, so treat every setup as a draft and size each position with care.
Free scan versus paid AI read
| Feature | Free or paid |
|---|---|
| Candle detection, trend bias, levels | free, unlimited, no account |
| Patterns, RSI 14, ATR 14 | free, unlimited |
| Trade setup with reward to risk | free, unlimited |
| Annotated PNG download and summary copy | free, unlimited |
| Written AI read with scenarios and risks | 3 free per day, then credits or a plan |
Free AI chart analysis FAQ
Is there a free AI chart analyzer?
Yes. This chart scan is free with no account and no daily limit. Only the written AI read is capped, at three free runs per day.
Do I need to sign up to analyze a chart?
No. You upload a screenshot and get the full result without an email or a password.
Why is the chart scan free?
The scan uses fixed rules on the pixels instead of a paid AI model, so each run costs us very little. That lets us keep it unlimited.
What does the paid AI read add?
It adds a written explanation, notes on visible indicators, two scenarios and the main risks. The model works from our measured levels, so it does not invent new ones.
Can I analyze crypto and forex charts for free?
Yes. Any screenshot with green and red candles works, whether it shows a stock, a coin or a currency pair.
Is free AI chart analysis accurate?
On our test charts it found every bar, and closes landed within 0.08 to 0.15 percent of the visible range on average. The setup is a rule, though, not a forecast.