AI stock chart analysis for daily and weekly charts
To get an AI stock chart analysis, upload a screenshot of any stock chart from your broker or charting app. The scanner measures every candle, then reports the trend, support and resistance, RSI 14, patterns and a setup with entry, stop and targets. It is free, needs no account, and works on light and dark themes.
By The Chartloupe team (Product and testing). Last updated .
PNG, JPG or WebP up to 10 MB. Candlestick or line charts.
Add the price range (optional, gives real prices)
Read the highest and lowest prices touched by the candles on your chart. Without them, levels are shown as a percent of the visible range.
How to run an AI stock chart analysis, step by step
- Open the stock in your charting app and pick a daily or weekly timeframe with at least 60 candles.
- Hide extra indicators and drawings so the candles stand out clearly.
- Capture the chart and paste it into the box above with Ctrl+V, or drop the file.
- Type the highest and lowest visible price if you want levels in dollars instead of percent.
- Run the scan, then compare the drawn levels with the gaps and earnings dates you know about.
The chart scan is free and unlimited, and the first 3 AI reads each day are free too. For more, see the pricing page for packs and plans, or read how we test the tool.
AI stock chart analysis tested on a real chart
We drew this test chart from a price series we know bar by bar, then ran it through this exact analyzer. So the error below is measured against the true prices, not estimated.
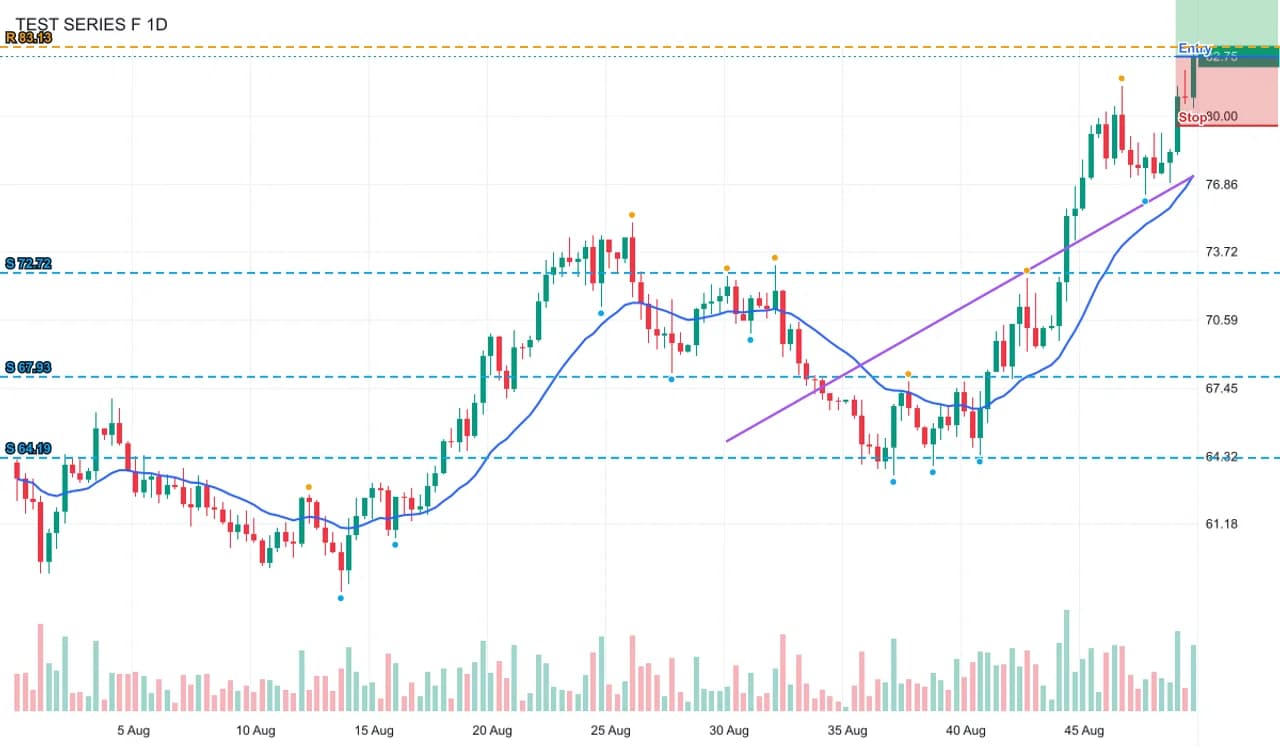
- Test input
- pullback-light.png (an uptrend with a deep pullback, light theme, EMA, drawn from a known price series)
- Output
- Annotated chart with levels, swings and setup
- Bars in the series
- 150
- Bars detected
- 150
- Mean close error
- 0.15% of range
- Worst close error
- 2.37% of range
- Bias
- bullish (+4 of 4 checks)
- RSI 14
- 74.2
- Levels found
- 4
- Setup
- long, reward to risk 2
- Confidence
- 84 of 100
- Annotated PNG size
- 57 KB
- Processing time
- 0.01 s
How we test: every page uses a chart from a known series, and we compare the detected bars with the true ones. More on the about page.
What AI stock chart analysis measures on a stock
First, the scanner finds each candle by its color and turns it into open, high, low and close values. Then it runs four trend checks on those bars. It looks at the slope of the last 60 closes, the swing structure, the 20 and 50 bar moving averages, and where price sits against the slower one. So a score of +3 of 4 means three checks point up.
Next, it clusters swing highs and swing lows into support and resistance. For example, a stock that bounced off $142 three times in two months gets a strong support there, while a single spike at $150 stays weak. Finally, RSI 14 and ATR 14 come from the same bars, so the stop distance matches how much the stock usually moves in one candle.
AI stock chart analysis on daily vs weekly charts
The timeframe changes what the numbers mean. On a daily chart, 60 closes cover about three months of trading, because the market is open roughly 21 days a month. On a weekly chart, the same 60 bars stretch over more than a year. As a result, a daily bias tells you about the current swing, while a weekly bias tells you about the larger trend.
A good habit is to scan both. If the weekly chart is bullish and the daily chart is pulling back to support, the two views agree on direction. In contrast, a bearish weekly with a bullish daily often means a bounce inside a larger decline. Also, the scan needs 30 or more bars, so zoom out on young stocks with a short history.
Earnings gaps, market hours and splits
Stocks have quirks that crypto charts do not. For instance, an earnings report often opens the stock 5 or 10 percent away from the prior close. That gap shows up as one very tall candle, so it raises the ATR and pushes stops wider for a few weeks. Therefore, check the calendar before trusting a setup that sits right after a report.
Market hours matter on intraday charts. The regular US session runs 9:30 a.m. to 4 p.m. Eastern, and some apps also draw thin premarket and after hours bars. Because those bars trade on low volume, they can create swing points that the regular session never respected. So switch extended hours off unless you trade them.
Splits are the last trap. Most charting apps adjust old prices after a split, but some broker views do not. An unadjusted 4 for 1 split looks like a 75 percent crash, which the scanner would read as a breakdown. Therefore, confirm the chart is split adjusted first.
What a stock screenshot cannot show
A picture holds only the visible candles. It has no fundamentals, no short interest, no options flow and no news. Also, the scanner does not read the axis text, which is why you type the high and low prices yourself. A chart covered with drawings, many moving averages or Heikin Ashi candles can hide bars, and the page warns you when it finds fewer than 30.
In short, this tool is the wrong choice when your decision depends on earnings quality, valuation or a pending headline. It is educational, not financial advice. Instead, use it to check your own read of the chart, and then size every position with care.
Stock chart details and how the scan handles them
| Stock chart detail | What to know |
|---|---|
| Daily chart, 60 bars | about three months of regular sessions |
| Weekly chart, 60 bars | a little over one year of price action |
| Earnings gap | one tall candle that widens ATR and stop distance |
| Extended hours bars | thin volume swings; hide them for cleaner levels |
| Unadjusted split | looks like a crash; use a split adjusted chart |
| Minimum bars | 30, with a warning shown below that |
AI stock chart analysis FAQ
Can AI analyze stock charts?
Yes. Upload a screenshot and the scanner reads the candles from the pixels, then reports trend, support and resistance, RSI and a setup. It works on charts from brokers and charting apps.
Can ChatGPT analyze stock charts?
A general chatbot can describe a chart, but it guesses the numbers. Our scan measures each candle first, and the optional AI read then explains those measured levels instead of inventing them.
Is there a free AI stock chart analyzer?
Yes. The chart scan here is free and unlimited, with no account needed. The written AI read gives three free runs a day.
Should I use a daily or weekly chart?
Use both if you can. The weekly chart shows the bigger trend, and the daily chart shows the current swing and closer levels.
Does it know about earnings or news?
No. The scan only sees the candles in your image, so check the earnings calendar and headlines yourself before acting on a setup.
Is the stock setup financial advice?
No. It is a rules based, educational read of the chart, and the confidence score is not a win rate.