Forex chart analysis AI for currency pairs
To get forex chart analysis with AI, upload a screenshot of any currency pair and type the chart high and low, such as 1.0912 and 1.0804. The scan returns the trend, support and resistance to four or five decimals, ATR, RSI and a setup. For ranges, it gives two breakout plans instead of a forced trade.
By The Chartloupe team (Product and testing). Last updated .
PNG, JPG or WebP up to 10 MB. Candlestick or line charts.
Add the price range (optional, gives real prices)
Read the highest and lowest prices touched by the candles on your chart. Without them, levels are shown as a percent of the visible range.
How to analyze a forex chart with AI, step by step
- Open the pair in your trading platform and choose a timeframe that shows 30 or more candles.
- Remove extra indicators so the green and red candles stand out, then capture the chart.
- Load the image and type the high and low with full decimals, for example 1.0912 and 1.0804.
- Check whether the result is a trend or a range before you look at the setup.
- Measure the stop in pips and download the annotated chart for your trading journal.
The chart scan is free and unlimited, and the first 3 AI reads each day are free too. For more, see the pricing page for packs and plans, or read how we test the tool.
Forex chart analysis AI tested on a real chart
We drew this test chart from a price series we know bar by bar, then ran it through this exact analyzer. So the error below is measured against the true prices, not estimated.
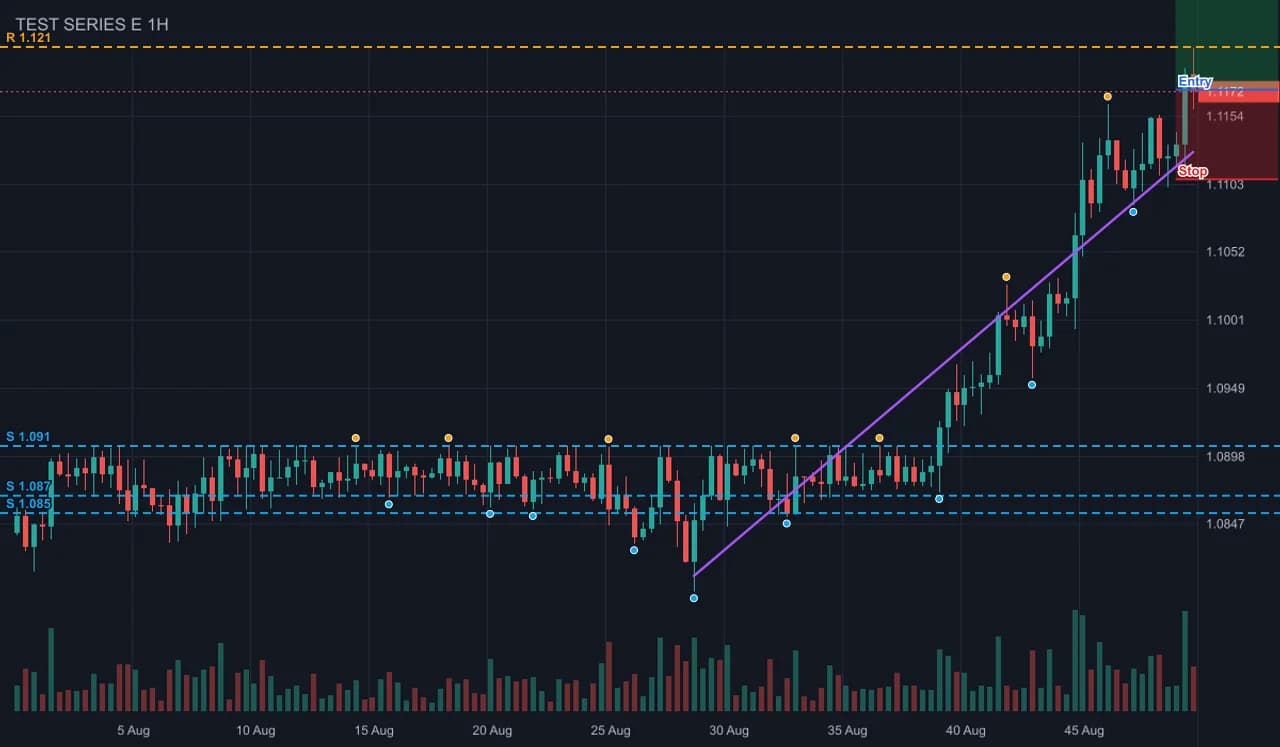
- Test input
- forex-range-breakout-dark.png (a forex-like range that breaks higher, dark theme, drawn from a known price series)
- Output
- Annotated chart with levels, swings and setup
- Bars in the series
- 140
- Bars detected
- 140
- Mean close error
- 0.10% of range
- Worst close error
- 0.26% of range
- Bias
- bullish (+4 of 4 checks)
- RSI 14
- 70.6
- Levels found
- 4
- Setup
- long, reward to risk 2
- Confidence
- 84 of 100
- Annotated PNG size
- 45 KB
- Processing time
- 0.01 s
How we test: every page uses a chart from a known series, and we compare the detected bars with the true ones. More on the about page.
Forex chart analysis AI with pips and decimals
Currency prices are small numbers with many decimals. EUR/USD might trade at 1.0853, and one pip is the fourth decimal, or 0.0001. In contrast, yen pairs such as USD/JPY quote to two decimals, so one pip is 0.01. Many brokers also show a fifth decimal, which is a tenth of a pip.
So when you type the chart high and low, use the same decimals the chart shows. For example, enter 1.0912 and 1.0804 for EUR/USD, or 151.84 and 149.62 for USD/JPY. The scan then prints every level at that precision. As a result, you can copy a support at 1.0850 straight into a pending order.
Next, look at the ATR. On a 1-hour EUR/USD chart it might be 0.0012, which is 12 pips. A stop behind support plus half an ATR then adds about 6 pips of buffer.
Sessions, ranges and breakouts
The forex week runs from Sunday evening to Friday evening, and three sessions shape the day. Tokyo is often quiet, London brings most of the volume, and New York overlaps London for a few busy hours. Because of that, many pairs build a tight range in Asia and break it later.
The scan spots this in two ways. First, a volatility squeeze appears when the last 10 bars have an ATR under 60 percent of the 40-bar ATR. Then a breakout or breakdown is flagged when price closes past the 20-bar high or low.
When the trend checks do not agree, the chart is a range. Therefore, you get two conditional plans instead of one trade: a long only on a close above resistance, and a short only on a close below support. Each plan puts its stop one ATR back inside the level.
Reading a trending currency pair
Trends in major pairs are often slow and steady. So the four trend checks matter more than one big candle. When three or four agree, you get a long or short setup with entry at the last price and a stop behind the nearest level.
Targets come from the chart too. The setup uses the next levels that sit at least one risk unit (1R) from entry. If none exist, target 1 is 2R and target 2 is one more R away. For instance, a 20-pip stop gives a first target 40 pips away when no level fits. Also, the confidence score reflects how well the checks agree, and it is never a win rate.
When forex chart analysis with AI falls short
A chart cannot see the economic calendar. For example, a jobs report or a central bank decision can move a pair 80 pips in a minute and break any level. Also, the scan has no view of spreads, swap costs or your broker's execution.
Similarly, very short charts like 1-minute bars are mostly noise, and some pairs trade thinly in the late New York hours. Finally, forex is usually traded with leverage, so losses can grow fast. Treat this as education, not financial advice, and keep each trade small.
Forex chart analysis AI: key numbers
| Forex detail | How it shows up in the scan |
|---|---|
| Pip size | 0.0001 on most pairs, 0.01 on yen pairs; type prices with the chart's decimals |
| Price entry | enter the high and low like 1.0912 and 1.0804 to get real levels |
| ATR 14 | shown in price units, so 0.0012 on EUR/USD means 12 pips |
| Asian range | a squeeze flag when recent ATR drops under 60% of the 40-bar ATR |
| Breakout | close above the 20-bar high or below the 20-bar low |
| Range plan | two conditional trades, stop one ATR back inside the level |
Forex chart analysis AI FAQ
Can AI analyze forex charts?
Yes. Upload a screenshot of any currency pair and the scan reads the candles, then shows the trend, levels, RSI, ATR and a setup. Type the high and low to see levels at four or five decimals.
Is there a free AI forex chart analyzer?
Yes. The chart scan is free and unlimited without an account. The written AI read has three free runs a day.
Does it work with yen pairs like USD/JPY?
Yes. Type the high and low with two or three decimals, such as 151.84 and 149.62, and the levels follow that format.
Which timeframe works best for forex chart analysis?
The 1-hour and 4-hour charts are a good start, because they show clear sessions and enough bars. Daily charts suit swing trades that last several days.
Can it tell me when to buy or sell a currency pair?
No. It gives a rule-based setup with entry, stop and targets, but it cannot know the next move. Use it as an educational second opinion.