Candlestick pattern recognition from a screenshot
Candlestick pattern recognition checks your chart against fixed rules and names the shapes it finds. To try it, upload a screenshot of a candlestick chart. The scanner measures each candle, then flags a doji, engulfing, hammer or shooting star on the last bar, plus double tops, breakouts, squeezes and RSI divergence across the chart.
By The Chartloupe team (Product and testing). Last updated .
PNG, JPG or WebP up to 10 MB. Candlestick or line charts.
Add the price range (optional, gives real prices)
Read the highest and lowest prices touched by the candles on your chart. Without them, levels are shown as a percent of the visible range.
How to find candlestick patterns on your chart, step by step
- Set your chart to plain candles, not Heikin Ashi or bars.
- Scroll so the newest candle sits at the right edge, since the candle rules read the last bar.
- Screenshot at least 40 candles so the squeeze and divergence checks have enough history.
- Upload the image and open the patterns list in the result.
- Check each flagged shape against the nearest support or resistance before you trust it.
The chart scan is free and unlimited, and the first 3 AI reads each day are free too. For more, see the pricing page for packs and plans, or read how we test the tool.
Candlestick pattern recognition tested on a real chart
We drew this test chart from a price series we know bar by bar, then ran it through this exact analyzer. So the error below is measured against the true prices, not estimated.
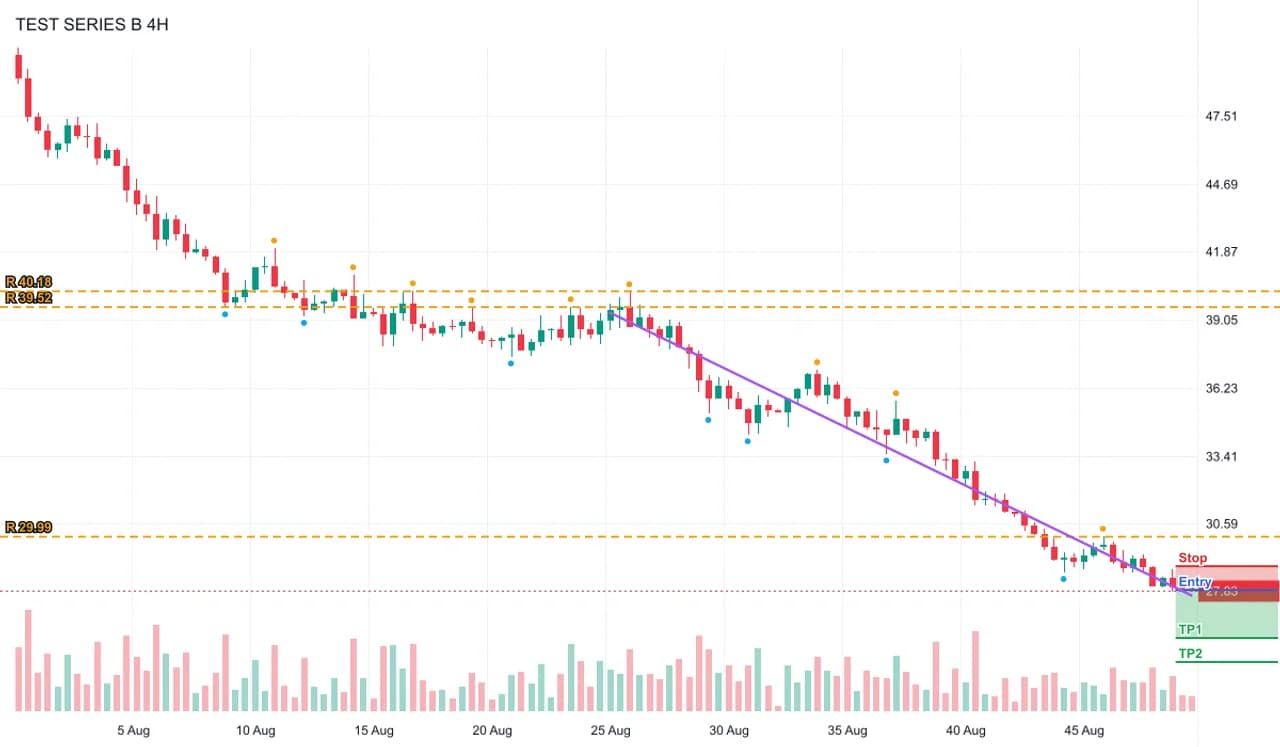
- Test input
- downtrend-light.png (a downtrend on a light theme with volume, drawn from a known price series)
- Output
- Annotated chart with levels, swings and setup
- Bars in the series
- 120
- Bars detected
- 120
- Mean close error
- 0.15% of range
- Worst close error
- 0.47% of range
- Bias
- bearish (-4 of 4 checks)
- RSI 14
- 24.4
- Levels found
- 3
- Setup
- short, reward to risk 2
- Confidence
- 74 of 100
- Annotated PNG size
- 43 KB
- Processing time
- 0.01 s
How we test: every page uses a chart from a known series, and we compare the detected bars with the true ones. More on the about page.
The exact rules behind candlestick pattern recognition
Every rule works on the open, high, low and close of each detected candle. First, a doji is a candle whose body is smaller than 10 percent of its full range. For example, a candle with a $2.00 range and a $0.15 body counts, because $0.15 is under $0.20. Next, a bullish engulfing needs a green last candle after a red one. The green body must also cover the red body. A bearish engulfing is the mirror image.
A hammer needs a lower wick at least twice the body and an upper wick no longer than half the body. So buyers rejected lower prices. In contrast, a shooting star flips those numbers. It needs an upper wick of at least twice the body and a short lower wick. The scan checks these four shapes in that order. It reports only the first match, so one candle never gets two labels.
Candlestick pattern recognition across many bars
Some patterns need more than one candle. A possible double top takes the two most recent swing highs, at least 5 bars apart and close enough in price to count as one level. Then a real dip must sit between them, and the last close must be back below the peaks. A double bottom uses the same rule upside down.
Also, a breakout is a close above the highest high of the prior 20 bars. A breakdown is a close below the lowest low. A volatility squeeze fires when the average range of the last 10 bars drops under 60 percent of the 40 bar average. Finally, bearish RSI divergence means a higher price high with an RSI high at least 3 points lower. The second high must also fall within the last 15 bars. Bullish divergence reverses both.
How reliable is candlestick pattern recognition?
The detection itself is precise. On our test charts built from known prices, the scanner found every bar. On average, closes landed within 0.08 to 0.15 percent of the visible range. Therefore, if a candle meets the doji rule on your image, it very likely meets it on the real data too.
However, a correct label is not a forecast. A hammer in the middle of a range means much less than a hammer on a strong support. Likewise, a double top that never breaks the dip between its peaks is only a possibility. That is why the result calls it a possible double top. It also shows the patterns next to the trend score and levels, instead of alone.
When pattern scanning is the wrong tool
Line charts carry no open, high or low. So when the scan falls back to its line tracer, the candle shapes are skipped. Heikin Ashi candles also break the rules, because their open and close are averages. In addition, the candle checks read only the last bar, so they will not list a hammer from three weeks ago.
If you want to study dozens of rare named patterns, this is not the tool. Also, if you need a backtested hit rate for a pattern, you need historical data, not one screenshot. This is educational, not financial advice, and every flag is a prompt to look closer rather than a signal to trade.
Candlestick and chart pattern rules used by the scan
| Pattern | Rule |
|---|---|
| Doji | body under 10% of the candle range |
| Bullish or bearish engulfing | last body opposite in color and covering the prior body |
| Hammer | lower wick at least 2x the body, upper wick at most 0.5x |
| Shooting star | upper wick at least 2x the body, lower wick at most 0.5x |
| Double top or bottom | two swings 5+ bars apart at one level, with a real dip or peak between |
| RSI divergence | new price extreme with RSI 3+ points weaker, within the last 15 bars |
Candlestick pattern recognition FAQ
Can AI recognize candlestick patterns?
Yes. This scanner reads the candles from your screenshot and applies fixed rules to name doji, engulfing, hammer and shooting star shapes, plus several multi bar patterns.
Is there a free candlestick pattern scanner?
Yes. The pattern scan here is free and unlimited, with no account. You only need a PNG, JPG or WebP screenshot.
What counts as a doji candle?
Here, a doji is any candle whose body is less than 10 percent of its high to low range. It signals indecision rather than direction.
How reliable are candlestick patterns?
On their own, not very. They work better at a known support or resistance level and in line with the trend, so use them as context and not as signals.
Why did the scan not find a pattern I can see?
The candle rules check only the last bar, and they report one shape at most. Also, a pattern that looks right to the eye may miss a rule by a small margin.