Trade setup generator for any chart screenshot
To use this trade setup generator, upload a screenshot of a candlestick chart. It reads the trend and the key levels, then plans an entry, a stop loss behind the nearest level and two targets. Each plan shows its reward to risk, so you can judge the trade before you size it.
By The Chartloupe team (Product and testing). Last updated .
PNG, JPG or WebP up to 10 MB. Candlestick or line charts.
Add the price range (optional, gives real prices)
Read the highest and lowest prices touched by the candles on your chart. Without them, levels are shown as a percent of the visible range.
How to generate a trade setup from a chart, step by step
- Screenshot the chart you want to trade, with enough history to show a few swings.
- Load the image into the box above by dropping, pasting or browsing for it.
- Type the top and bottom price of the chart so the plan uses real numbers.
- Generate the setup and note the entry, stop, both targets and the R value.
- Size the position so a hit stop costs no more than 1% of your account.
The chart scan is free and unlimited, and the first 3 AI reads each day are free too. For more, see the pricing page for packs and plans, or read how we test the tool.
Trade setup generator tested on a real chart
We drew this test chart from a price series we know bar by bar, then ran it through this exact analyzer. So the error below is measured against the true prices, not estimated.
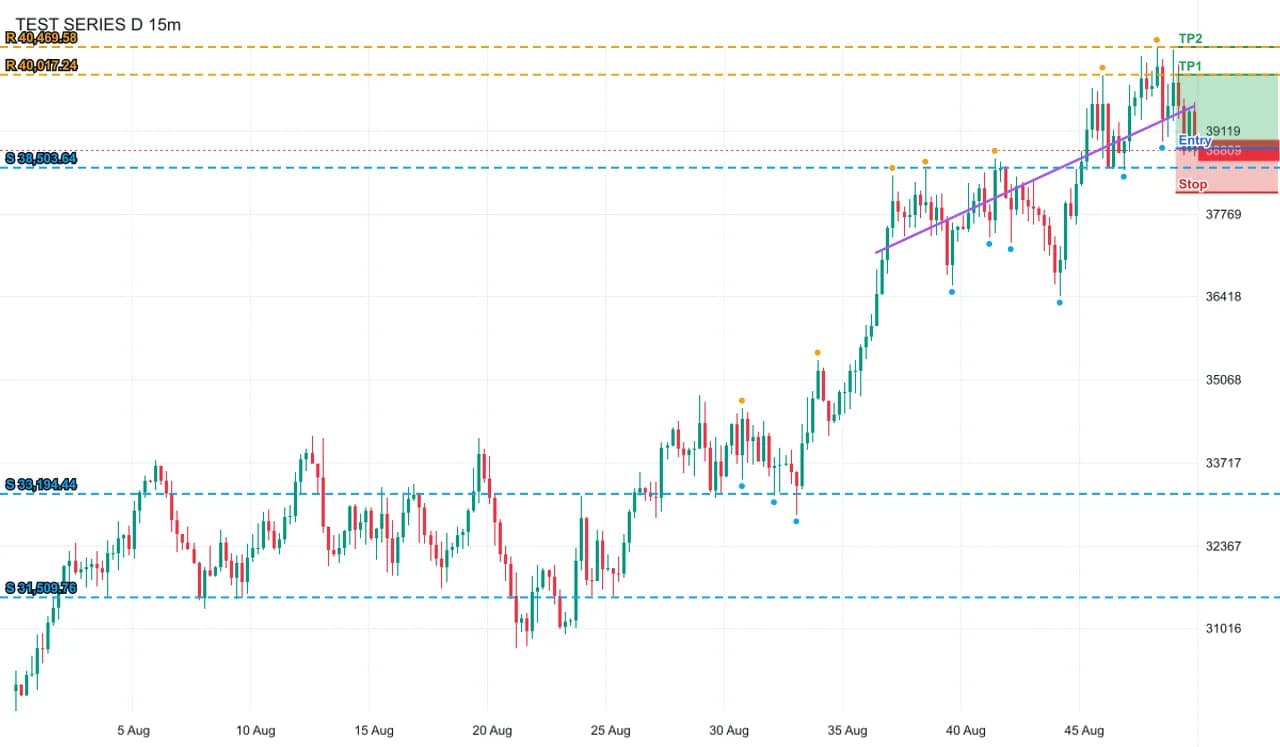
- Test input
- crypto-dense-light.png (220 dense bars at crypto-like prices, light theme, drawn from a known price series)
- Output
- Annotated chart with levels, swings and setup
- Bars in the series
- 220
- Bars detected
- 220
- Mean close error
- 0.08% of range
- Worst close error
- 0.36% of range
- Bias
- bullish (+3 of 4 checks)
- RSI 14
- 48.1
- Levels found
- 5
- Setup
- long, reward to risk 1.7
- Confidence
- 75 of 100
- Annotated PNG size
- 50 KB
- Processing time
- 0.01 s
How we test: every page uses a chart from a known series, and we compare the detected bars with the true ones. More on the about page.
How the trade setup generator builds a plan
First, the scan decides the bias with four trend checks. When three or four agree, the chart is trending, and the plan is a long or a short right now. In that case, the entry is the last price on the chart. Next comes the stop loss. It goes behind the nearest support for a long, or above the nearest resistance for a short, plus half an average true range as a buffer. If no level is close, the stop sits 1.5 ATR from entry instead.
Then the targets follow. They are the next levels in the trade direction that sit at least one risk unit, or 1R, away from entry. If there are none, target one is 2R and target two is one more R beyond it. As a result, target one always pays at least as much as the stop costs.
Ranges work differently. When the trend checks disagree, buying in the middle has no edge, so the trade setup generator gives two conditional plans instead. The long starts only on a close above resistance, and the short only on a close below support. For both, the stop sits one ATR back inside the broken level. For example, with resistance at 50 dollars and an ATR of 1 dollar, a breakout long uses a stop at 49 dollars.
Trade setup generator example: the reward to risk math
Say the chart shows an uptrend and the last price is 100 dollars. The nearest support is at 97 dollars, and the ATR is 2 dollars. So the stop goes at 97 minus 1, which is 96 dollars. That makes the risk 4 dollars per share, and 1R equals 4 dollars.
Now look at the resistance levels at 102, 107 and 112 dollars. The level at 102 is only 2 dollars away, which is less than 1R, so it is skipped. Therefore, target one is 107 dollars with a reward to risk of 7 divided by 4, or 1.75. Target two is 112 dollars, which gives 12 divided by 4, or 3.0.
In contrast, if the chart had no resistance above, the plan would use 2R and 3R. That means targets at 108 and 112 dollars.
Position sizing with the 1% rule
A setup tells you where to get out, but not how much to buy. For that, many traders use a simple rule: risk no more than 1% of the account on one trade. This is a common habit, not a feature the tool enforces.
Take the same example with a 10,000 dollar account. One percent is 100 dollars. Because each share risks 4 dollars, you can buy 25 shares, which is a 2,500 dollar position. So if the stop is hit, you lose about 100 dollars, not a quarter of your money. Also, gaps and fast markets can fill a stop worse than planned, so leave some slack.
When a generated setup is the wrong tool
The generator follows fixed rules on the bars in your screenshot. So it cannot see earnings dates, news, spreads or the order book. Also, a chart with fewer than 30 bars gives a weak read, and the page warns you about it.
The confidence score runs from 5 to 90 and measures how well the checks agree. However, it is not a win rate. Above all, this is an educational tool and not financial advice, so check every plan against your own rules.
Setup rules at a glance
| Part | Rule |
|---|---|
| Entry (trend) | last price, long in a bullish bias, short in a bearish bias |
| Stop loss | behind the nearest level plus 0.5 ATR, or 1.5 ATR with no level near |
| Targets | next levels at least 1R away; if none, 2R and 3R |
| Range plans | long on a close above resistance, short on a close below support |
| Range stop | 1 ATR back inside the broken level |
| Confidence | 5 to 90 of 100, based on agreement, level quality and bar count |
Trade setup generator FAQ
What is a good reward to risk ratio?
Many traders look for at least 1.5 to 2. Here, target one of a trending setup is always 1R or more away, and each plan shows its exact ratio.
How do you calculate position size from a stop loss?
Divide the money you are willing to lose by the distance from entry to stop. With 100 dollars of risk and a 4 dollar stop, that is 25 shares.
Can AI generate trade setups from a chart?
Yes. This tool reads a chart screenshot and builds entry, stop and targets from measured levels. The optional AI read then explains the plan in words.
Is the trade setup generator free?
Yes. The chart scan and setup are free and unlimited, with no account. Only the written AI read has a daily limit.
Does a high confidence score mean the trade will win?
No. It shows how well the trend checks and levels agree, not the odds of profit.