The AI chart analyzer that shows its work
This AI chart analyzer reads a screenshot of any candlestick chart and draws the answer on it: the trend, support and resistance, patterns and a setup with entry, stop and targets. Drop or paste the image below. The scan is free, takes under a second and needs no account.
- Bars
- 120/120
- Bias
- +3 of 4
- RSI 14
- 63.6
- Levels
- 4
By The Chartloupe team (Product and testing). Last updated .
PNG, JPG or WebP up to 10 MB. Candlestick or line charts.
Add the price range (optional, gives real prices)
Read the highest and lowest prices touched by the candles on your chart. Without them, levels are shown as a percent of the visible range.
How the AI chart analyzer works
First, our server finds every candle in the image and turns it into open, high, low and close values. Then it runs four trend checks, groups the swing points into support and resistance, and looks for common patterns. After that, it builds a setup from those levels and draws everything on your own screenshot.
Because the scan uses fixed rules, the same chart always gets the same answer, and you can check each line on the picture. The optional AI read then adds a vision model that explains what the rules cannot see, such as an indicator panel or the timeframe.
From a raw screenshot to what the AI chart analyzer draws
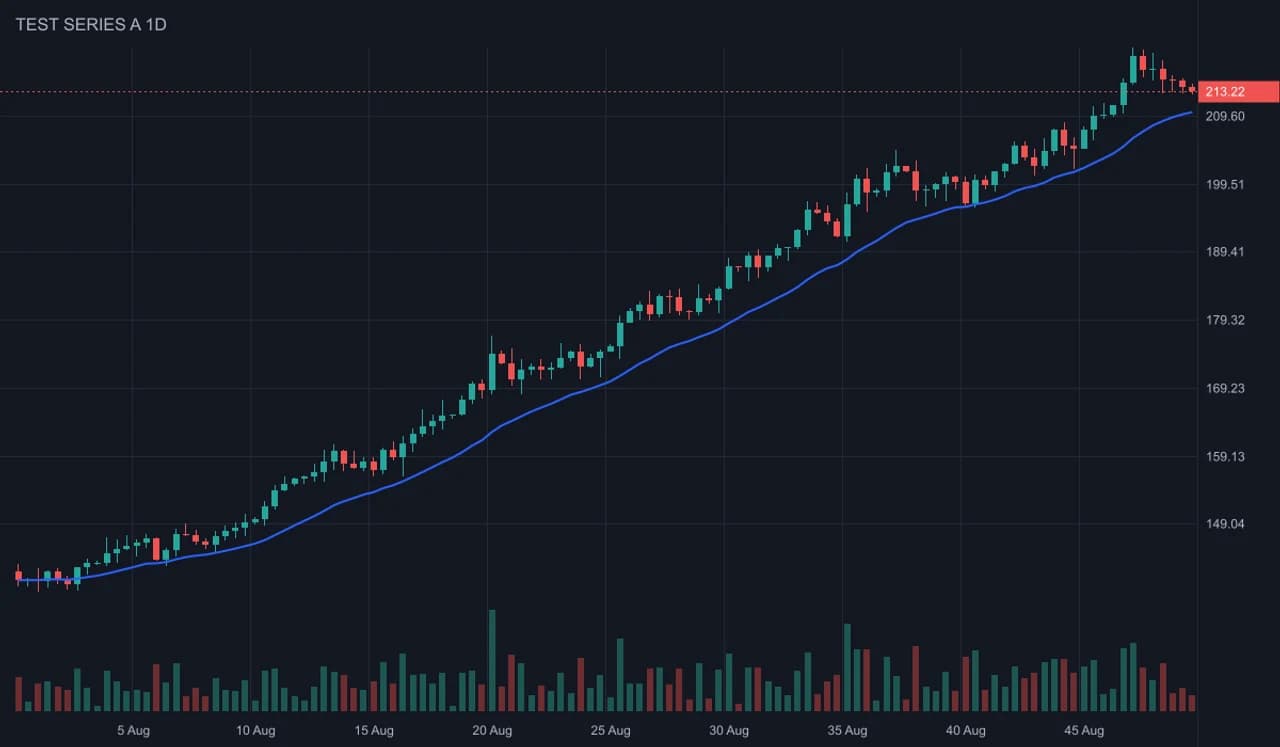
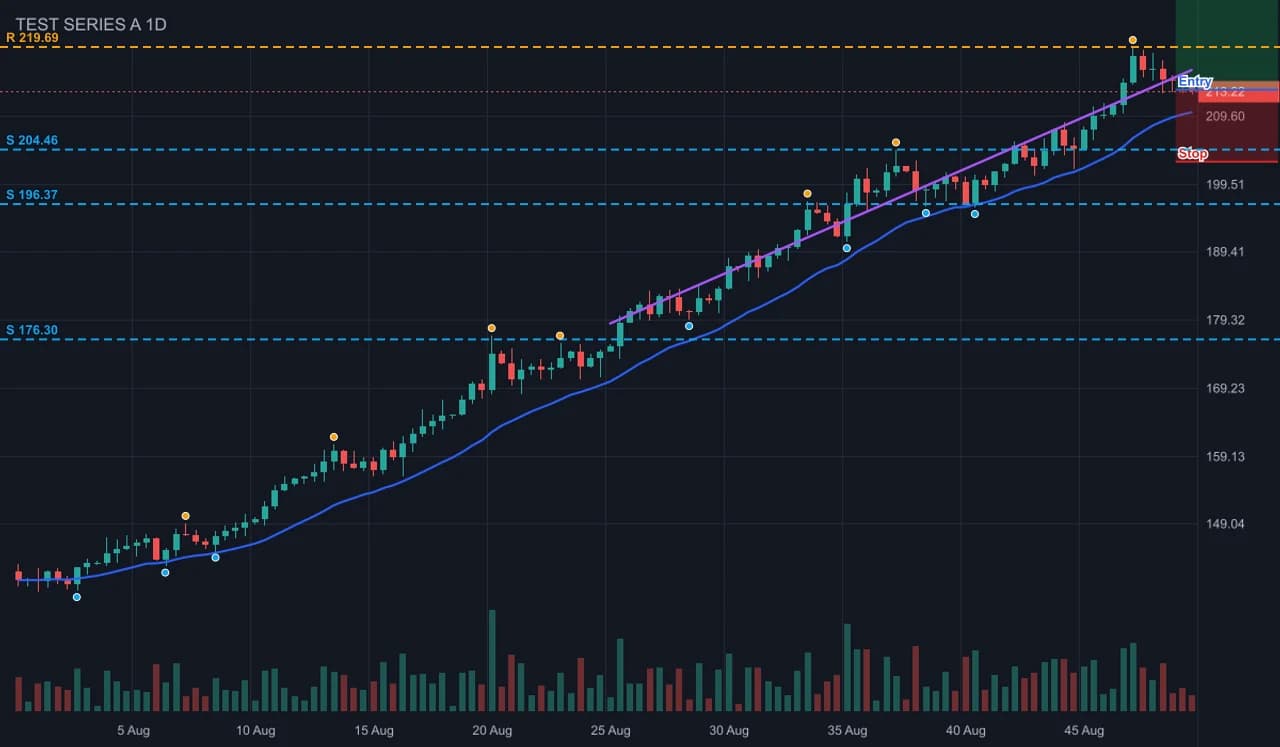
First, drag the seam. On the left is our test screenshot, exactly as you would upload it. On the right is what the analyzer drew on it in one pass: the levels, the swing points, the trend line and the setup zones.
Six real scans from the AI chart analyzer
These are the free scanner's own outputs on our six test charts. The same code that runs on this page drew them. So every number in the strip under each chart is from that run.

01Stock, dark theme
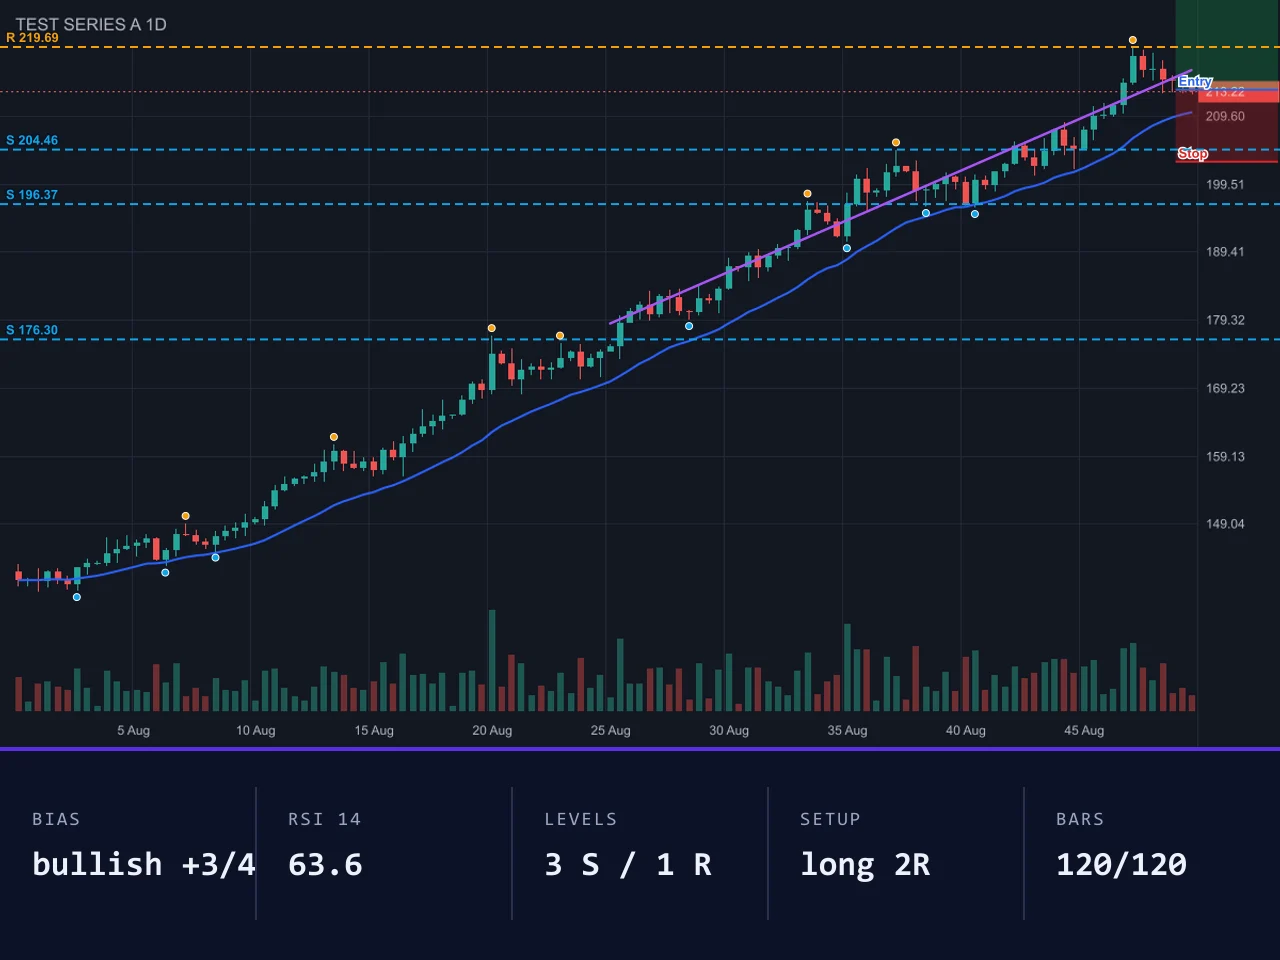
A stock uptrend, read bar by bar
First, the scanner found all 120 of 120 candles and left the volume pane out. Then three of four trend checks voted up (+3), and RSI sat at 63.6. Finally, the rules drew 3 support and 1 resistance level with a long setup at 2 to 1 reward to risk.
Learn more about A stock uptrend, read bar by bar

02Sideways range
A range with levels that held
Here the lower level was touched 5 times, so it scores as strong. Even so, the trend checks leaned down (-3 of 4) inside the box. So the read says that plainly instead of calling it a clean range.
Learn more about A range with levels that held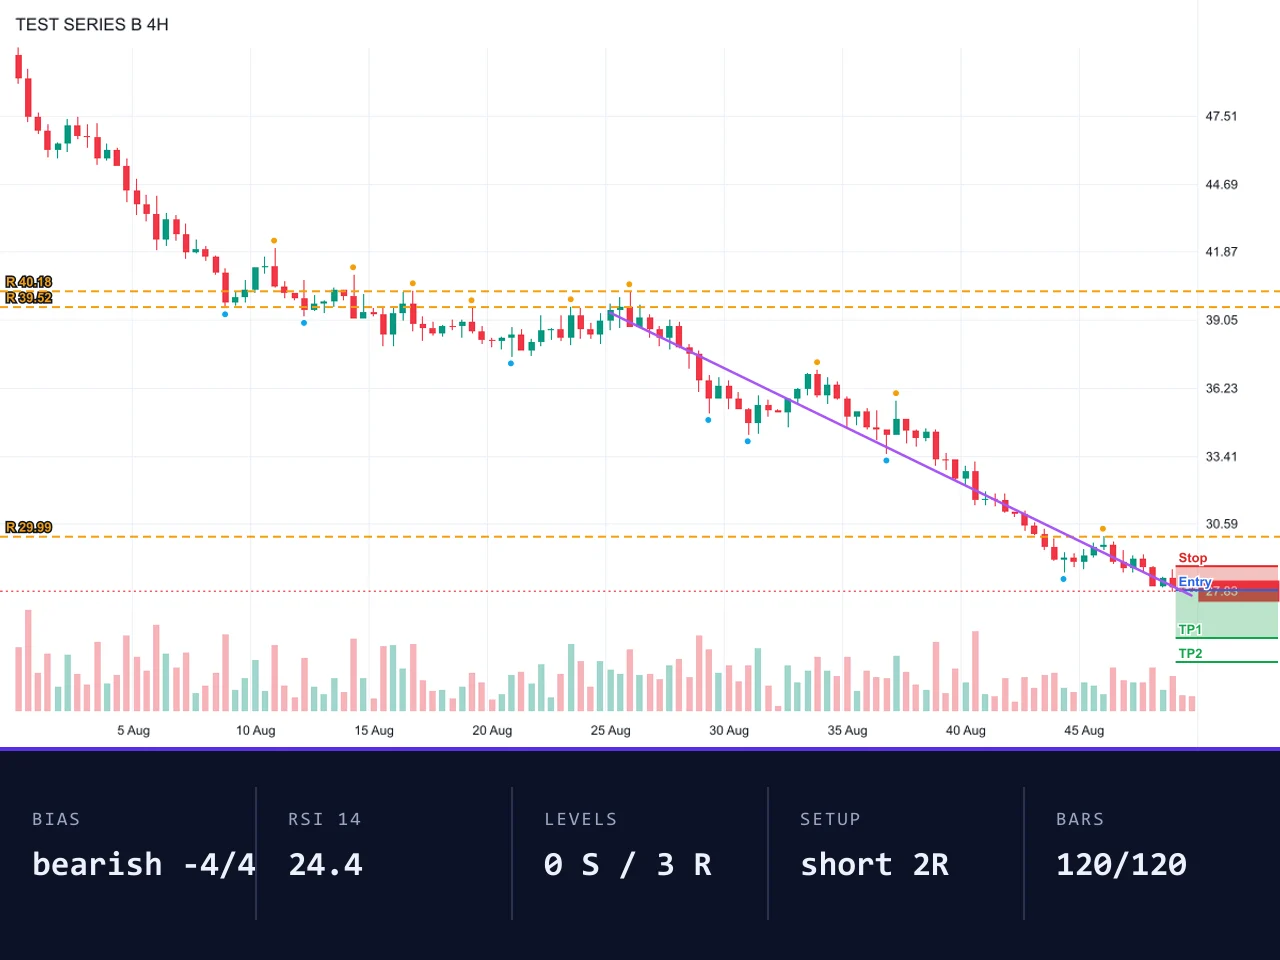

03Light theme
A downtrend on a light chart
Also, light themes work the same way. Here all four checks voted down (-4) and RSI fell to 24.4. In addition, the last bar matched one named pattern: shooting-star-shaped last candle (sellers rejected higher prices).
Learn more about A downtrend on a light chart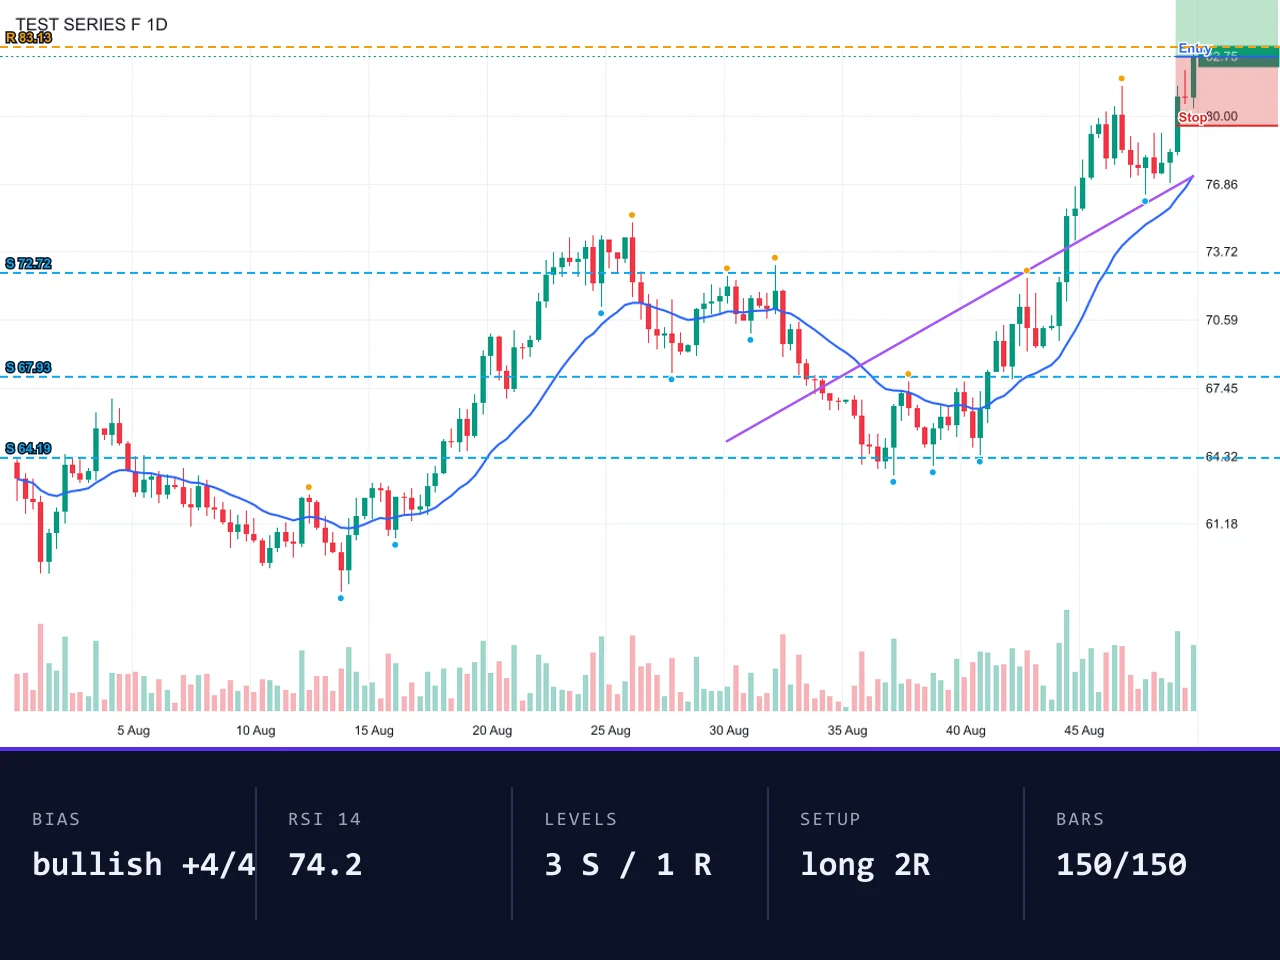

04Pullback and breakout
Patterns named, not guessed
Next, on a pullback in an uptrend the rules found 2 patterns: breakout above the 20-bar high (81.36) and bullish engulfing on the last candle. Each one is a fixed rule, so you can check it on the candles yourself.
Learn more about Patterns named, not guessed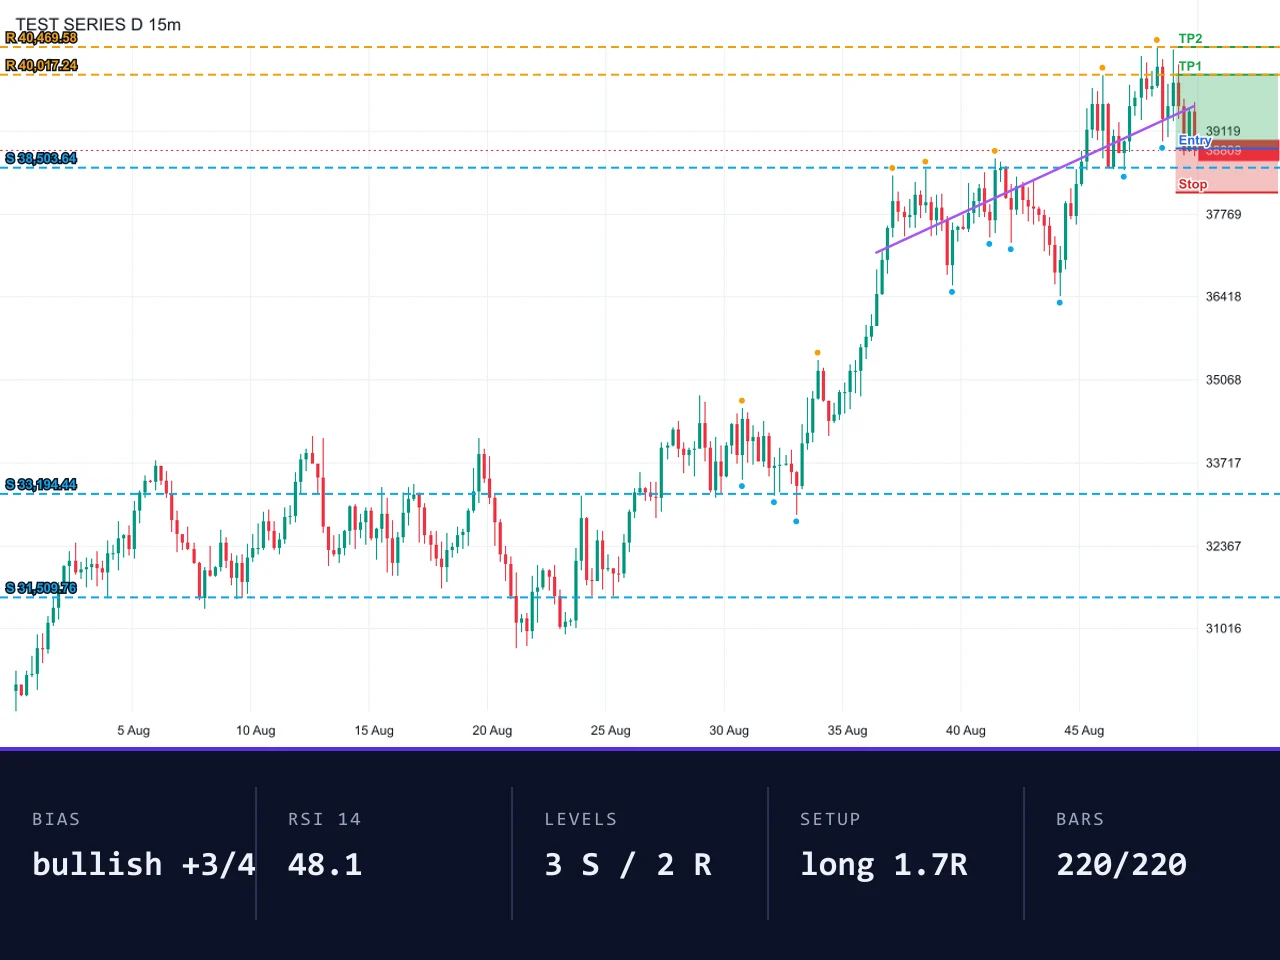

05Crypto, 220 bars
Dense crypto candles, all found
Even 220 thin candles side by side were split one by one (220 found). With the price range typed in, every level comes back in real prices. For example, support sits at 38,503.64.
Learn more about Dense crypto candles, all found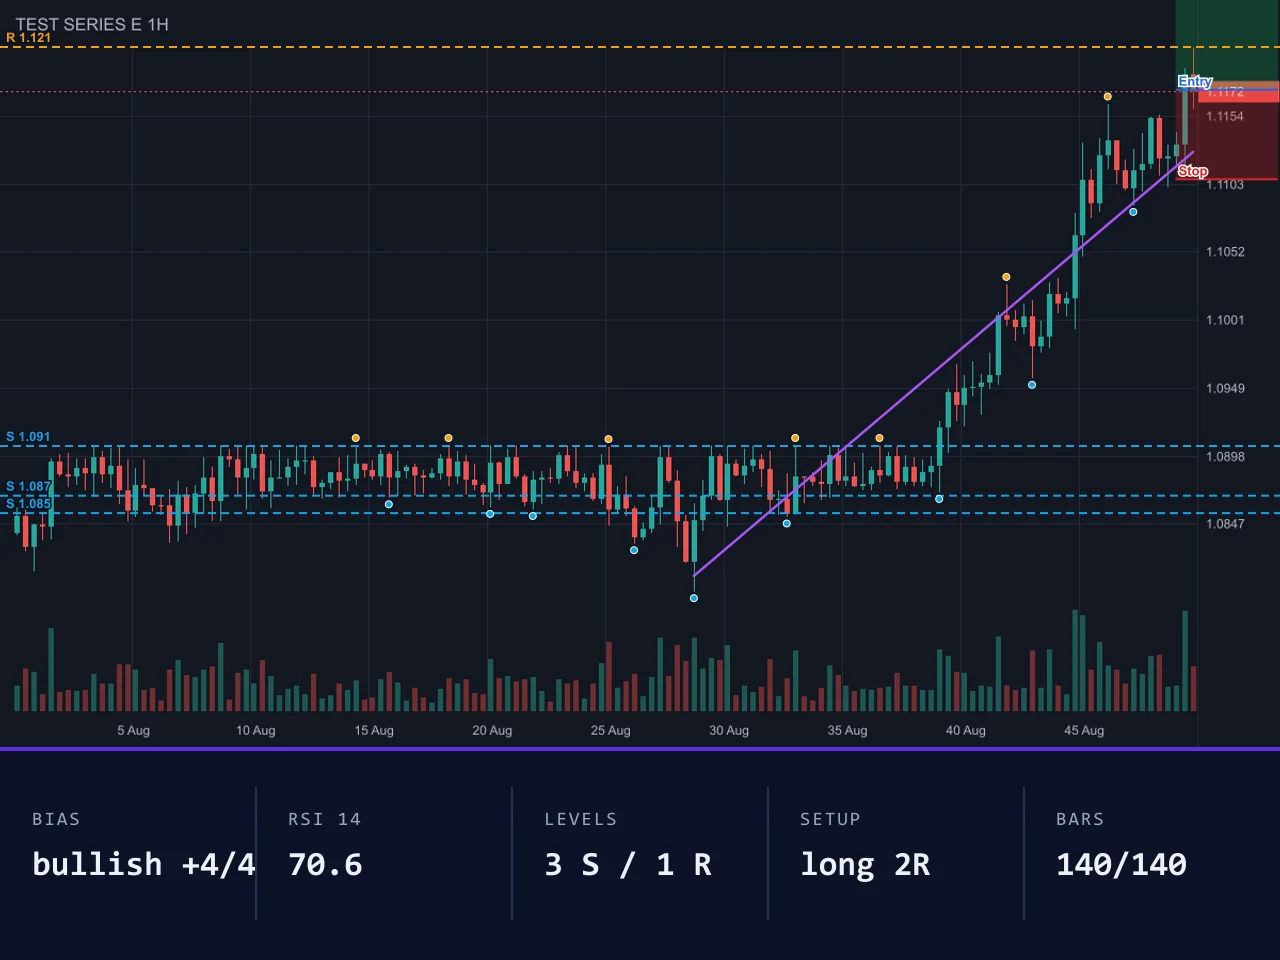

06Forex breakout
A forex range that broke out
Finally, the forex chart left its range, so the scanner flagged the breakout above the 20-bar high (1.116). It also found a support with 6 touches below and a long setup at 2 to 1 reward to risk. It is a description of the picture, not a trade plan.
Learn more about A forex range that broke out
Your own chart, read in seconds
Drop a screenshot from any charting app and check every line on the picture. Also, it is free and needs no sign up.
Every line the AI chart analyzer draws has a reason
After all, a level you cannot check is just an opinion. That is why the free scan uses fixed rules, not a model. So the same chart always gets the same answer. For example, it found 850 of 850 candles on our six test charts. Every line it draws comes from those candles.
AI chart analyzer tested on a real chart
We drew this test chart from a price series we know bar by bar, then ran it through this exact analyzer. So the error below is measured against the true prices, not estimated.
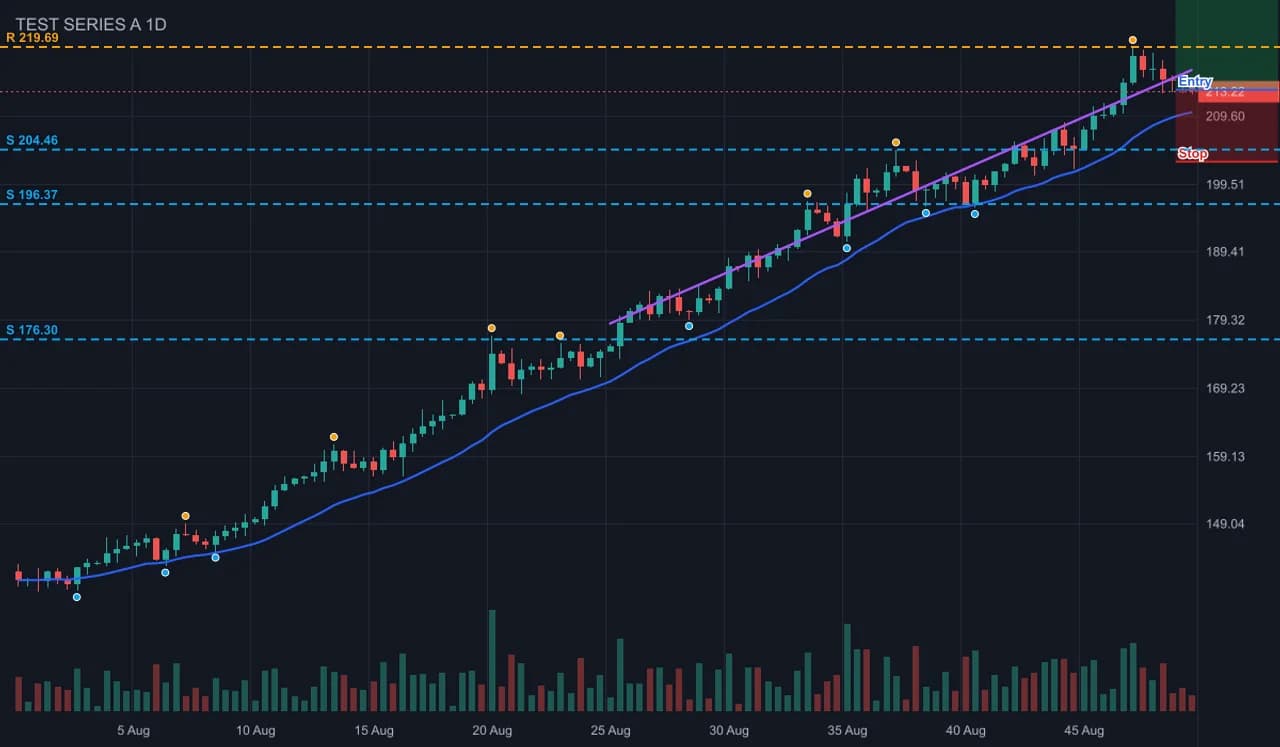
- Test input
- uptrend-stock-dark.png (a stock-like uptrend, dark theme, volume pane and a 20 EMA, drawn from a known price series)
- Output
- Annotated chart with levels, swings and setup
- Bars in the series
- 120
- Bars detected
- 120
- Mean close error
- 0.12% of range
- Worst close error
- 1.93% of range
- Bias
- bullish (+3 of 4 checks)
- RSI 14
- 63.6
- Levels found
- 4
- Setup
- long, reward to risk 2
- Confidence
- 75 of 100
- Annotated PNG size
- 55 KB
- Processing time
- 0.06 s
How we test: every page uses a chart from a known series, and we compare the detected bars with the true ones. More on the about page.
Pricing
The chart scan is free for everyone. However, if you want the written AI read on many charts a day, a pack or a plan costs less per read. See the pricing page for details.
Also, every scan draws the levels, swings and setup on your chart. The annotated PNG is yours, with no sign up.
Start free- Written AI read per chart
- Clean PNG without the credit line
- Credits never expire
- About $0.10 per AI read
- Clean PNG without the credit line
- Priority support
- Cancel anytime
- Clean PNG without the credit line
- Priority support
- For daily chart reviews
- Priority queue
- Everything in Starter
Comparisons
Not sure a rule based scan is enough? Then read these honest comparisons before you decide. Each one also says when the other option is the better pick.
AI chart analyzer FAQ
What does this AI chart analyzer do?
It reads a chart screenshot and reports the trend, the nearest support and resistance levels, clear candle patterns, RSI, and a setup with entry, stop and two targets, drawn on your image.
Is the chart analyzer free?
Yes. The scan is free and unlimited, and it needs no account. The written AI read has three free runs a day; packs and plans add more.
Is this financial advice?
No. It is an educational tool that describes the picture you upload. It cannot see news, order flow or the future, so make your own decisions and manage your risk.
Do you keep my chart?
No. The image stays in memory while it is analyzed and is dropped as soon as the result is sent back.