AI trading chart analysis for your trade plan
To use AI trading chart analysis in your plan, upload a screenshot of the chart you want to trade. The scan returns the trend bias, the nearest support and resistance, an entry, a stop, two targets and the reward to risk. Then you size the position so one loss stays small.
By The Chartloupe team (Product and testing). Last updated .
PNG, JPG or WebP up to 10 MB. Candlestick or line charts.
Add the price range (optional, gives real prices)
Read the highest and lowest prices touched by the candles on your chart. Without them, levels are shown as a percent of the visible range.
How to plan a trade with AI trading chart analysis, step by step
- Pick the market and timeframe you actually trade, then screenshot that chart.
- Upload the image and type the chart's high and low price so the levels come back in real prices.
- Check the bias score and skip the trade if the checks do not agree.
- Compare the stop distance with your account risk and work out the position size.
- Write down the entry, stop and both targets before you open your broker.
The chart scan is free and unlimited, and the first 3 AI reads each day are free too. For more, see the pricing page for packs and plans, or read how we test the tool.
AI trading chart analysis tested on a real chart
We drew this test chart from a price series we know bar by bar, then ran it through this exact analyzer. So the error below is measured against the true prices, not estimated.
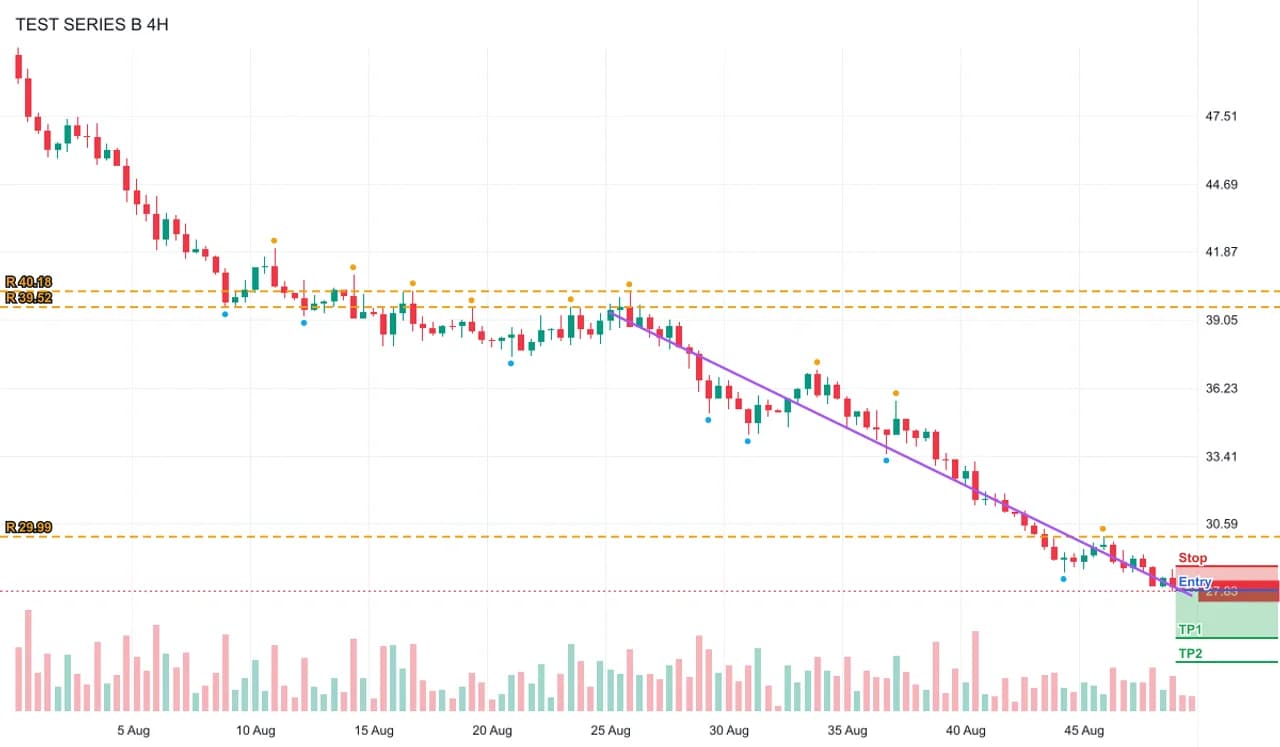
- Test input
- downtrend-light.png (a downtrend on a light theme with volume, drawn from a known price series)
- Output
- Annotated chart with levels, swings and setup
- Bars in the series
- 120
- Bars detected
- 120
- Mean close error
- 0.15% of range
- Worst close error
- 0.47% of range
- Bias
- bearish (-4 of 4 checks)
- RSI 14
- 24.4
- Levels found
- 3
- Setup
- short, reward to risk 2
- Confidence
- 74 of 100
- Annotated PNG size
- 43 KB
- Processing time
- 0.02 s
How we test: every page uses a chart from a known series, and we compare the detected bars with the true ones. More on the about page.
Where the read fits in a trader's workflow
Most traders lose money on trades they never planned. So the scan belongs before the order, not after it. First, you pick a chart from your watchlist. Next, you upload it and read the bias. If the score is "+1 of 4", the trend checks disagree, and the chart is a range or noise.
Then you look at the levels. Each one shows its strength: weak for one touch, moderate for two, strong for three or more. A long entry right under a strong resistance is a poor spot, because the price has already turned there several times.
Finally, you copy the summary into a journal. After 20 or 30 trades, you can see which setups worked for you and which did not.
How AI trading chart analysis builds the setup
When the chart trends, the setup is a long or a short now. The entry is the last price. The stop sits behind the nearest level plus half an average true range, or 1.5 ATR back when no level is close.
For the targets, the scan picks the next support or resistance levels that sit at least one risk unit (1R) away from the entry. If there are none, target 1 is 2R and target 2 is target 1 plus 1R. As a result, target 1 always pays at least as much as the stop costs.
A range works differently. Instead of a trade now, you get two conditional plans. The long only counts on a close above resistance, and the short only on a close below support. In both cases the stop goes one ATR back inside the level.
Risk per trade and reward to risk
The setup gives you prices, but you still choose the size. A common rule is to risk 1 percent of the account per trade. For example, with $10,000 and a stop $2 below entry, you would buy 50 shares, because 50 times $2 is $100.
Reward to risk tells you whether the trade is worth that $100. At 2R, one win covers two losses. So a trader who wins 40 percent of the time can still come out ahead. In contrast, at 0.8R you need to win more than half your trades just to break even.
Also, remember that the confidence score, from 5 to 90, shows how well the checks agree. It is not a win rate, so do not use it to size up.
When this is the wrong tool for your trading
A screenshot freezes one moment. For instance, it cannot follow a scalp on the one minute chart, and it knows nothing about earnings, rate decisions or the order book. If your edge comes from news or order flow, the scan adds little.
Also, charts with fewer than 30 bars give thin levels, and the page warns you when that happens. Above all, this is an educational tool, not financial advice. Treat the plan as a draft and check it against your own rules.
Trade plan fields from AI trading chart analysis
| Field | How it is set |
|---|---|
| Entry | last price on a trending chart; a close beyond the level on a range |
| Stop | nearest level plus half an ATR, or 1.5 ATR when no level is near |
| Target 1 | next level at least 1R away, otherwise 2R |
| Target 2 | the following level at least 1R away, otherwise target 1 plus 1R |
| Reward to risk | target distance divided by stop distance, shown per target |
| Confidence | 5 to 90 of 100, from check agreement, level quality and bar count |
AI trading chart analysis FAQ
Can AI help me plan a trade?
Yes. Upload a chart and you get a bias, levels, an entry, a stop and two targets with the reward to risk. You still decide the size and whether to take it.
What is a good reward to risk ratio for trading?
Many traders look for 2 to 1 or better. At that ratio, a 40 percent win rate can still be profitable before costs.
How much should I risk per trade?
A common guideline is 1 percent of the account or less per trade. The stop distance from the scan helps you turn that into a position size.
Is AI trading chart analysis reliable?
The candle detection is measured and consistent, since the same chart gives the same result. However, no chart read can predict the next move, so treat each setup as a plan, not a promise.
Does the confidence score mean my chance of winning?
No. It measures how well the trend checks, levels and bar count agree. It is not a win rate.
Can I use it for day trading?
Yes, on any timeframe you can screenshot. However, it does not stream live prices, so for fast scalps you would need to upload a new chart each time.