Stock chart reader for beginners
A stock chart reader turns a chart screenshot into plain answers. To use it, upload a picture of any stock chart and the tool marks the trend, the key price levels and the last candle, then explains each one in simple words. You do not need to know chart terms first, and the scan is free.
By The Chartloupe team (Product and testing). Last updated .
PNG, JPG or WebP up to 10 MB. Candlestick or line charts.
Add the price range (optional, gives real prices)
Read the highest and lowest prices touched by the candles on your chart. Without them, levels are shown as a percent of the visible range.
How to read a stock chart with the reader, step by step
- Pick any stock in your app and switch the chart type to candles.
- Take a screenshot that shows at least a few months of price history.
- Drop the picture into the reader, or paste it with Ctrl+V.
- Start with the trend line on the result, then look at the colored levels.
- Read the short notes next to each item and compare them with the chart yourself.
The chart scan is free and unlimited, and the first 3 AI reads each day are free too. For more, see the pricing page for packs and plans, or read how we test the tool.
Stock chart reader tested on a real chart
We drew this test chart from a price series we know bar by bar, then ran it through this exact analyzer. So the error below is measured against the true prices, not estimated.
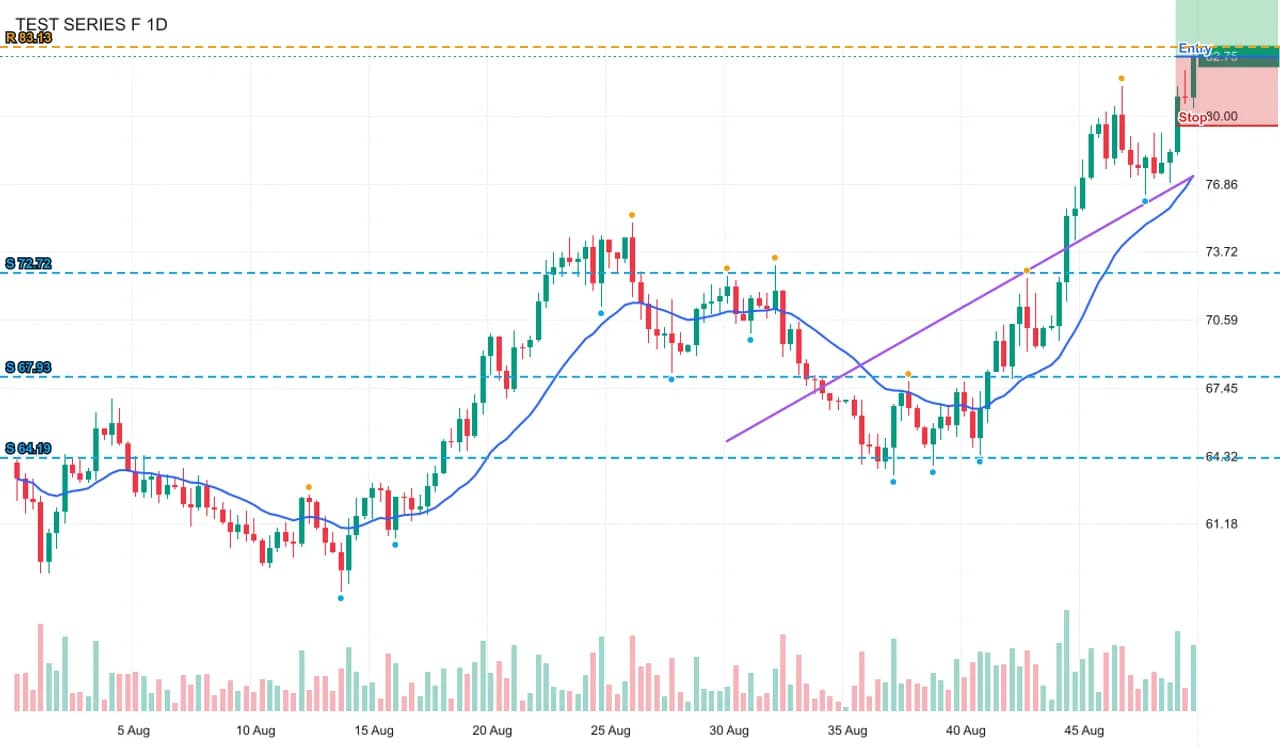
- Test input
- pullback-light.png (an uptrend with a deep pullback, light theme, EMA, drawn from a known price series)
- Output
- Annotated chart with levels, swings and setup
- Bars in the series
- 150
- Bars detected
- 150
- Mean close error
- 0.15% of range
- Worst close error
- 2.37% of range
- Bias
- bullish (+4 of 4 checks)
- RSI 14
- 74.2
- Levels found
- 4
- Setup
- long, reward to risk 2
- Confidence
- 84 of 100
- Annotated PNG size
- 57 KB
- Processing time
- 0.02 s
How we test: every page uses a chart from a known series, and we compare the detected bars with the true ones. More on the about page.
What the stock chart reader explains first
Every candle shows one period of trading, such as one day. The thick part is the body. It runs from the opening price to the closing price. A green body means the stock closed higher than it opened, and a red body means it closed lower. So a row of tall green bodies tells you buyers were in control.
The thin lines above and below the body are wicks. They mark the highest and lowest prices of that period. For example, a candle with a long lower wick means sellers pushed the price down, but buyers bought it back before the close. The reader finds every candle this way and turns it into four numbers: open, high, low and close.
How to spot the trend
A trend is simply the direction price keeps moving. In an uptrend, each high and each low is a bit higher than the one before. In a downtrend, both keep getting lower. However, the eye is easy to fool, so the reader runs four checks and shows the result as a score, such as +3 of 4.
Those checks are the slope of the last 60 closes, the pattern of highs and lows, two moving averages, and whether price sits above or below the slower average. When three or four agree, the chart has a bullish or bearish bias. Otherwise, the reader calls it a range, which means price is moving sideways.
Support, resistance and what a stock chart reader draws
Support is a price where the stock stopped falling more than once. Resistance is a price where it stopped rising. Think of them as a floor and a ceiling. The reader finds these turning points, groups the ones that sit close together, and draws up to three levels above and three below the current price.
Each level gets a label. One touch is weak, two touches are moderate, and three or more are strong. For instance, if a stock bounced near $48 three times, that floor is strong. Next, the reader adds RSI, a 0 to 100 gauge of recent momentum. Readings above 70 often mean the stock ran up fast, while readings below 30 mean it fell fast.
When a chart reader will not help
A chart only shows past prices. It cannot tell you whether a company is healthy, whether earnings are coming, or what the news will be. Also, the reader does not read the numbers on the price axis, so type the top and bottom prices if you want levels in dollars.
Busy charts are another limit. Many indicator lines, drawings or unusual candle styles can hide bars, and the page warns you if it finds fewer than 30. Above all, this is a learning tool and not financial advice. Use it to practice reading charts, and then decide for yourself.
Chart terms the reader explains
| Chart term | What it means |
|---|---|
| Candle body | the range between the open and the close |
| Wick | the high and low reached during that period |
| Green or red | closed above or below the open |
| Trend score | how many of four trend checks agree, such as +3 of 4 |
| Support and resistance | floors and ceilings where price turned before |
| RSI 14 | momentum from 0 to 100; above 70 is stretched, below 30 is washed out |
Stock chart reader FAQ
How do you read a stock chart for beginners?
Start with the trend, then find the floors and ceilings where price turned before. After that, look at the last few candles to see who won the most recent periods.
Is there an app that reads stock charts for you?
Yes. This reader works in the browser: upload a screenshot and it explains the trend, levels and last candle in plain words, with no account.
What do the green and red candles mean?
A green candle closed higher than it opened, and a red candle closed lower. The wicks show the highest and lowest prices in between.
What does a long wick on a candle mean?
It means price traveled far in one direction but was pushed back before the close. A long lower wick shows buying, and a long upper wick shows selling.
Can a chart reader tell me which stock to buy?
No. It explains what the chart shows, but it is an educational tool and not financial advice.