TradingView chart analysis with AI from a snapshot
To get TradingView chart analysis with AI, take a snapshot of your chart with Alt+S, copy the image, and paste it into the box above. The analyzer reads the candles and returns the trend, support and resistance, patterns, RSI and a setup drawn on your picture. It is free and needs no account.
By The Chartloupe team (Product and testing). Last updated .
PNG, JPG or WebP up to 10 MB. Candlestick or line charts.
Add the price range (optional, gives real prices)
Read the highest and lowest prices touched by the candles on your chart. Without them, levels are shown as a percent of the visible range.
How to analyze a TradingView chart with AI, step by step
- Hide your drawings and extra indicators so only the candles and volume stay on screen.
- Zoom the time axis until roughly 50 to 150 bars fill the chart.
- Press Alt+S or the camera icon, then pick Copy image.
- Paste the snapshot here with Ctrl+V and type the visible high and low if you want real prices.
- Run the scan and download the marked up PNG for your notes.
The chart scan is free and unlimited, and the first 3 AI reads each day are free too. For more, see the pricing page for packs and plans, or read how we test the tool.
TradingView chart analysis AI tested on a real chart
We drew this test chart from a price series we know bar by bar, then ran it through this exact analyzer. So the error below is measured against the true prices, not estimated.
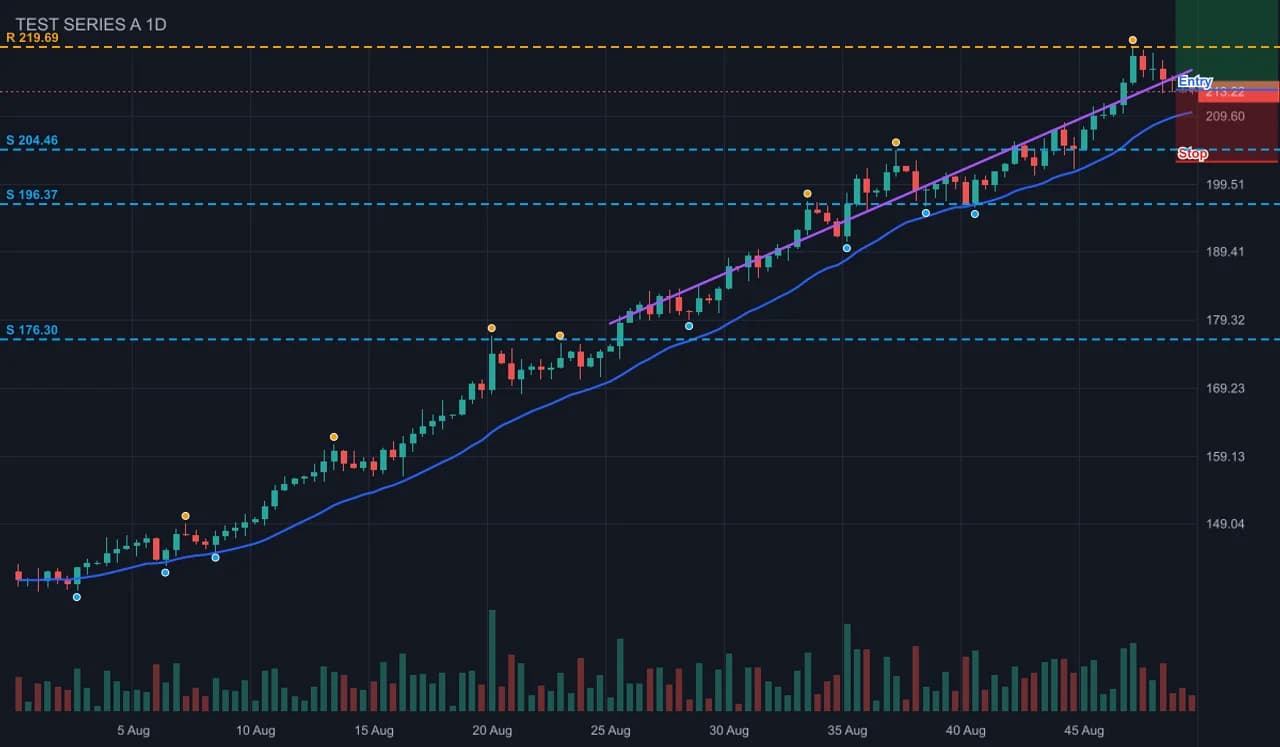
- Test input
- uptrend-stock-dark.png (a stock-like uptrend, dark theme, volume pane and a 20 EMA, drawn from a known price series)
- Output
- Annotated chart with levels, swings and setup
- Bars in the series
- 120
- Bars detected
- 120
- Mean close error
- 0.12% of range
- Worst close error
- 1.93% of range
- Bias
- bullish (+3 of 4 checks)
- RSI 14
- 63.6
- Levels found
- 4
- Setup
- long, reward to risk 2
- Confidence
- 75 of 100
- Annotated PNG size
- 55 KB
- Processing time
- 0.01 s
How we test: every page uses a chart from a known series, and we compare the detected bars with the true ones. More on the about page.
How to take a clean TradingView screenshot
First, clear the chart. Click the eye icon in the left drawing toolbar to hide all drawings, and remove moving averages or bands that sit on top of the candles. A line that crosses a candle is the main source of error: on our test charts, the worst single bar was off by 2.4 percent exactly where a moving average cut through it.
Next, set the zoom. Scroll on the time axis until you see about 50 to 150 bars. Fewer than 30 bars gives weak levels, and the page will warn you. Far more than 150 makes each candle only a few pixels wide.
Then take the snapshot. The camera icon in the top toolbar opens a menu with Download image and Copy image, and Alt+S (Option+S on a Mac) works as a shortcut. Copy image is fastest, because you can paste it here right away.
Dark or light theme, both work
TradingView ships a dark and a light theme, and the analyzer reads both. It looks for green or teal bodies and red bodies, so the default candle colors are ideal. However, if you changed your candles to blue and orange, or to hollow white bars, switch back to the defaults for the snapshot.
Also, keep the volume pane if you like. The detector drops volume bars, the grid, the axis text and the dashed last price line before it measures anything. Heikin Ashi candles are a different story, though, since they are averaged and give false closes.
What TradingView chart analysis with AI reads from the image
The scan turns every candle into open, high, low and close values. From those, it runs four trend checks, finds swing highs and lows, and groups them into up to three levels above and three below price. It also computes RSI 14 and ATR 14 from the detected bars, and it flags patterns such as engulfing candles, a squeeze or a breakout above the 20 bar high.
It does not read the axis labels, because there is no text recognition. So type the highest and lowest price you see on the right scale. Otherwise, levels show as a percent of the visible range. As a result, a quick glance at the price scale turns every level into a number you can enter as an alert.
When AI analysis of a TradingView chart is the wrong tool
A snapshot has no live data. For example, it cannot follow the next candle, fire an alert, or see an indicator you hid. If you want to automate a strategy, a Pine Script on the platform itself is the better route.
Also, charts packed with drawings, custom candle colors or Renko bricks can confuse the detector. Finally, this is an educational tool and not financial advice, so treat each setup as one input to your own plan.
TradingView snapshot settings that work best
| Setting | Recommendation |
|---|---|
| Bars visible | about 50 to 150, never under 30 |
| Candle colors | default green or teal and red, dark or light theme |
| Drawings and overlays | hidden; lines crossing candles add error |
| Chart type | regular candles; line charts fall back to a line tracer |
| Snapshot | Alt+S or the camera icon, then Copy image |
| File | PNG, JPG or WebP up to 10 MB |
TradingView chart analysis AI FAQ
Can AI analyze TradingView charts?
Yes. Take a snapshot of the chart and upload it here, and the analyzer reads the candles from the image. You get the trend, levels, patterns, RSI and a setup.
How do I take a screenshot on TradingView?
Press Alt+S on Windows or Option+S on a Mac, or click the camera icon in the top toolbar. Then choose Copy image or Download image.
Is AI analysis of a TradingView chart free?
Yes. The scan of your snapshot is free and unlimited with no account. The written AI read has three free runs per day.
Should I hide indicators before taking the snapshot?
Yes, hide the ones drawn over the candles. Moving averages and drawings that cross a candle cause most detection errors, while a separate volume pane is fine.
Does it work with the TradingView dark theme?
Yes. Both dark and light themes work, as long as the candles use green or teal and red.
Can it read the prices on the TradingView axis?
No, it does not read axis text. Type the highest and lowest price on the chart to get levels in real prices.