Best AI for stock chart analysis: four kinds of tools compared
The best AI for stock chart analysis depends on what you need. A rules-based scanner gives exact levels and a setup for free. A general AI chatbot explains context in plain words but can misread prices. Dedicated chart apps add alerts and watchlists. Finally, charting platforms find patterns on live data, not screenshots.
By The Chartloupe team (Product and testing). Last updated .
Side by side
| Rules-based scanner | General AI chatbot | Chart analysis app | Charting platform tools | |
|---|---|---|---|---|
| Input | Chart screenshot | Chart screenshot plus your question | Chart screenshot | Live price data |
| How levels are found | Measured from candle pixels | Estimated by a language model | Mostly a vision model | Computed from exact prices |
| Same chart, same answer | Yes, every time | No, answers vary between runs | Usually not | Yes |
| Shows its work | Draws levels, swings and stops on the chart | Text only | Text and cards | Drawings on the live chart |
| Typical free tier | Unlimited scans, 3 AI reads a day here | Limited image uploads per day | Often 3 lifetime analyses | Some tools need a paid plan |
| Best for | A quick, checkable read of one chart | Asking follow-up questions | Alerts and a daily brief | Scanning many tickers |
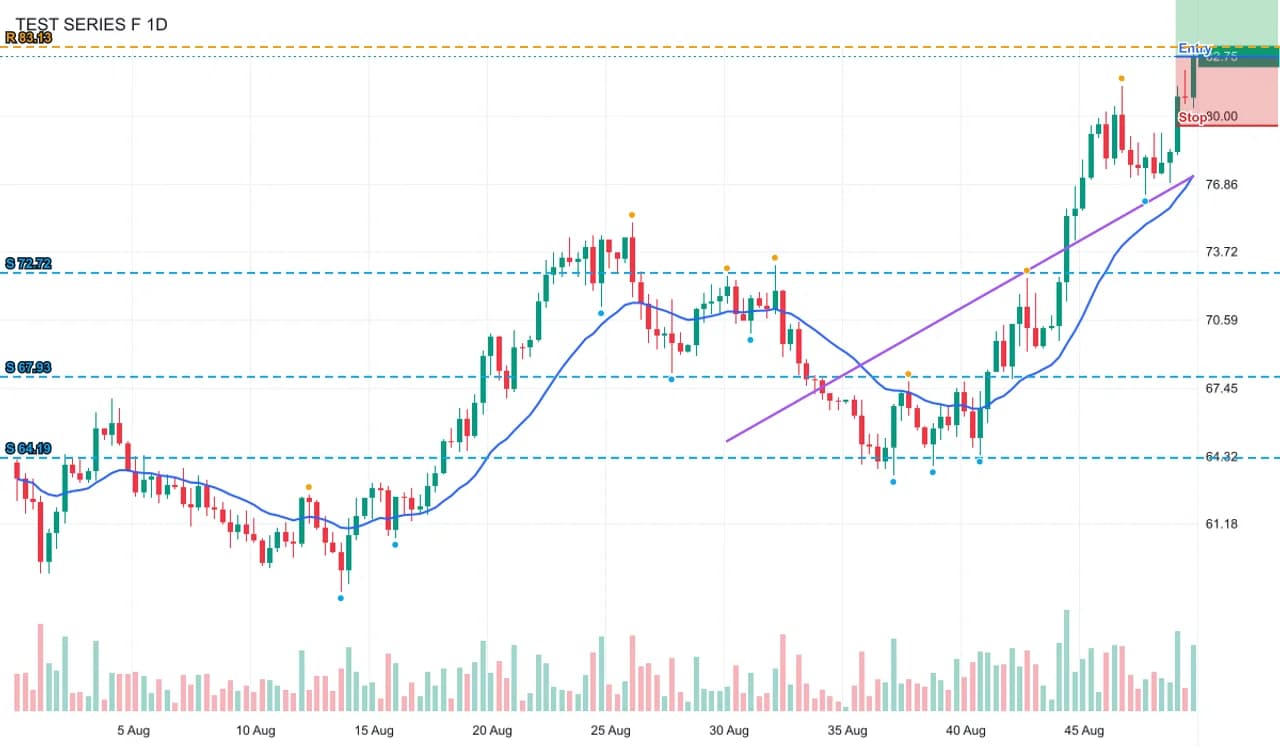
What the best AI for stock chart analysis should get right
A chart read is only useful when you can check it. So the first test is simple: does the tool show where each level came from? A good answer points at the swing highs and lows that built the level. It also tells you how many times price touched it.
The second test is consistency. For example, upload the same screenshot twice. A measured scan returns the same numbers both times, because it reads pixels with fixed rules. In contrast, a language model may move a level or flip the bias between runs.
The third test is honesty about limits. No tool can see news, earnings dates or order flow in a picture. Therefore, the best tools say what they cannot know and keep a clear line between a read of the past and a forecast.
Rules-based scanners: exact and free
Our scanner is in this group. It finds each candle by color, turns it into open, high, low and close values, and then runs fixed checks. As a result, it reports the trend from four checks, support and resistance from swing clusters, RSI 14, ATR 14 and a setup with a stop behind the level.
We test it on charts drawn from known price series. On six test charts it found every candle, with a mean close error between 0.08% and 0.15% of the visible range. Each scan took under 60 ms.
The weak spot is style. Monochrome candles, Heikin Ashi and charts buried under indicators are hard to read by color. In those cases, the tool says so instead of guessing.
General AI chatbots: good at words, weak at numbers
Chatbots with image input can describe a chart in plain English. They are also good at follow-up questions, such as why a double top matters or what RSI means. That makes them a fine tutor.
However, they estimate prices by looking at the picture, much like a person would at a glance. So a level can land a few percent away from the real one, and the answer can change on the next run. Use them for context, then check each number yourself.
Chart apps and charting platforms
Dedicated chart apps mostly send your screenshot to a vision model and format the reply into cards. Many add a watchlist, price alerts and a daily brief. Free tiers are often small, such as a few lifetime analyses before a subscription.
Charting platforms work on live data instead of screenshots. Their built-in pattern and screener tools are precise, because they use exact prices. Still, they need an account, and some features sit behind paid plans. Meanwhile, a screenshot tool works with any broker or app you already use.
When another tool is the best AI for your chart analysis
Pick something else if you need live alerts, many tickers at once, or order flow data. Also skip it for line charts with no candles when you want exact swing points, since a line hides highs and lows. Finally, remember that every tool here reads the past. None of them is financial advice.
Frequently asked questions
What is the best AI for stock chart analysis for beginners?
Start with a tool that shows its work, such as a scanner that draws the levels on your chart. Then use a chatbot to ask what each part means.
Can ChatGPT analyze stock charts?
Yes, it can describe a screenshot and explain patterns. However, it estimates prices from the image, so check its levels against the chart before you use them.
Is there a free AI stock chart analyzer?
Yes. Our chart scan is free and unlimited, and the written AI read has 3 free runs a day. Many chart apps offer only a few free analyses in total.
Can the best AI chart analysis predict stock prices?
No tool can predict prices reliably from a picture. A chart read describes the trend, the levels and the risk of a setup, which helps you plan but does not forecast.
Which timeframe works best for AI chart analysis?
Daily charts with 60 to 200 candles give the clearest read. Also scan the weekly chart to see the larger trend.