Crypto chart analysis AI for any coin
To get crypto chart analysis with AI, upload a screenshot of any coin chart from your exchange app or TradingView. The scan finds each candle, then reports the trend, support and resistance, RSI, ATR and a setup with entry, stop and targets. It is free, it needs no account, and it takes under a second.
By The Chartloupe team (Product and testing). Last updated .
PNG, JPG or WebP up to 10 MB. Candlestick or line charts.
Add the price range (optional, gives real prices)
Read the highest and lowest prices touched by the candles on your chart. Without them, levels are shown as a percent of the visible range.
How to run crypto chart analysis with AI, step by step
- Open the coin in your exchange app or charting site and pick a timeframe with at least 30 candles.
- Hide extra drawings and indicator overlays, then take a clean screenshot of the candles.
- Paste the image into the box with Ctrl+V, or drop the file from your phone or desktop.
- Add the top and bottom price of the chart if you want levels in real coin prices.
- Run the scan, compare the stop distance with the ATR, and save the marked-up PNG.
The chart scan is free and unlimited, and the first 3 AI reads each day are free too. For more, see the pricing page for packs and plans, or read how we test the tool.
Crypto chart analysis AI tested on a real chart
We drew this test chart from a price series we know bar by bar, then ran it through this exact analyzer. So the error below is measured against the true prices, not estimated.
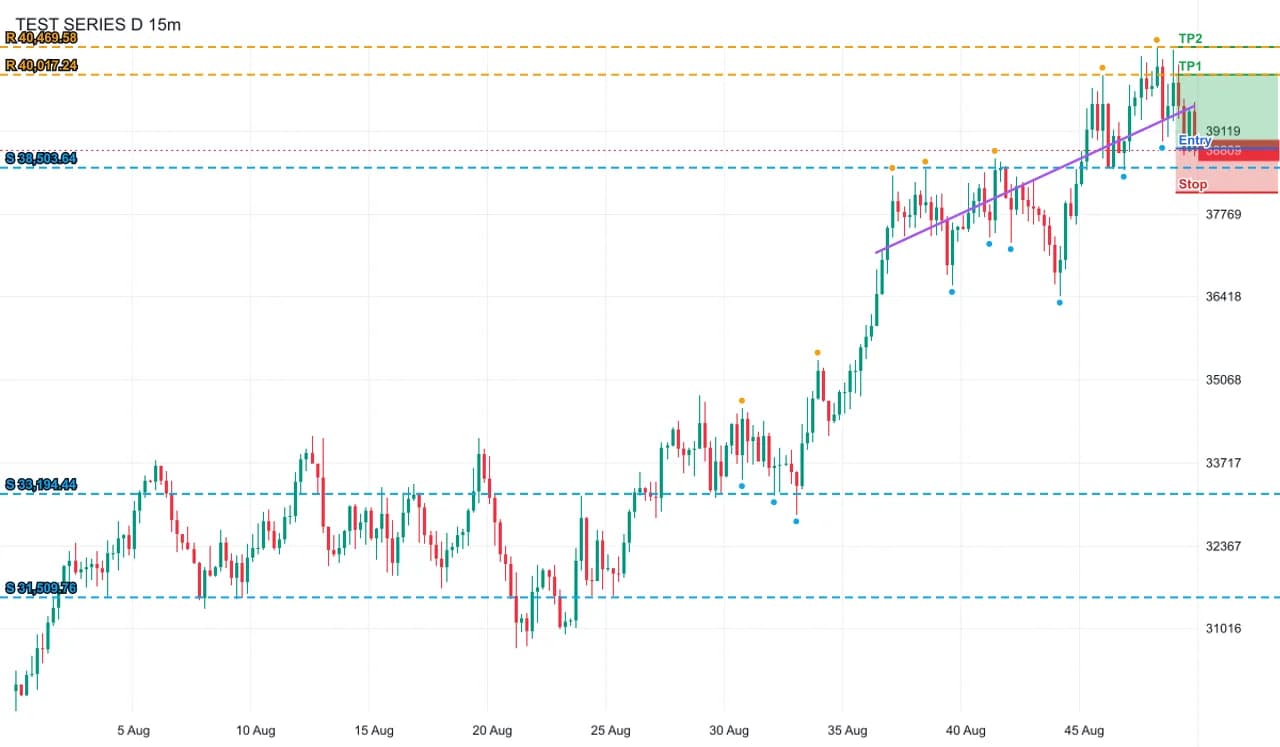
- Test input
- crypto-dense-light.png (220 dense bars at crypto-like prices, light theme, drawn from a known price series)
- Output
- Annotated chart with levels, swings and setup
- Bars in the series
- 220
- Bars detected
- 220
- Mean close error
- 0.08% of range
- Worst close error
- 0.36% of range
- Bias
- bullish (+3 of 4 checks)
- RSI 14
- 48.1
- Levels found
- 5
- Setup
- long, reward to risk 1.7
- Confidence
- 75 of 100
- Annotated PNG size
- 50 KB
- Processing time
- 0.01 s
How we test: every page uses a chart from a known series, and we compare the detected bars with the true ones. More on the about page.
Why crypto chart analysis AI needs different habits
Crypto never closes. There is no Friday bell and no weekend gap, so a daily candle is a full 24 hours of trading. As a result, levels form faster, and a trend can flip while you sleep. A quick scan of a fresh screenshot helps you check the chart again before you act.
Volatility is the second difference. A small altcoin can move 8 to 15 percent in a day, while a large stock often moves 1 or 2 percent. For that reason, the scan reports ATR 14 next to every setup. When the ATR is large, the stop sits further away, and the position should be smaller to keep the same dollar risk.
Also, many coins trade on thin books. So one market order can print a candle that looks important but carries little real interest. Level strength helps here, because a level with three touches is worth more than one sharp spike.
Long wicks, liquidations and your stop
Crypto charts are full of long wicks. Often they come from forced liquidations on leveraged positions, where price stabs through a level and snaps back within minutes. A stop placed exactly on the level gets hit, even though the level held.
Therefore, the setup never puts the stop right on a level. Instead, it goes behind the nearest level plus half an ATR. If no level is close, the stop sits 1.5 ATR away. For example, if a coin trades at 2.40 with an ATR of 0.12, the extra buffer is 0.06. You can then judge whether the wider stop still leaves a fair reward to risk.
Next, the pivot logic uses candle highs and lows, so wick tips count as touches. In contrast, a line chart only shows closes. That is why candles give a better crypto read than a line.
Altcoins, dense charts and exchange screenshots
Exchange apps pack a lot onto one screen. There is often an order book, a depth chart, volume bars and a price tag on the right. The scan drops the grid, text, volume bars and the dashed last-price line. However, it works best when the candles fill most of the image, so crop out the order panel first.
Dense charts are fine. A 4-hour chart with 150 thin candles still reads well, because each bar is found by its green or red color. On the other hand, fewer than 30 bars gives a warning, since the trend checks and RSI need more history.
Finally, altcoin prices can have many decimals. If a coin trades near 0.000412, type the top and bottom prices exactly as the chart shows them. Otherwise, the levels appear as a percent of the visible range, which still works for planning.
When this crypto tool is the wrong choice
A screenshot cannot show funding rates, open interest, the order book or on-chain flows. So if your trade depends on those, use a tool built for that data. The scan also cannot see news, token unlocks or an exchange outage.
Also, very new coins with a few hours of history rarely have enough bars. Heikin Ashi candles and charts covered in drawings can confuse the detector as well. Above all, this is education and not financial advice. Crypto can drop fast, so never risk money you cannot afford to lose.
Crypto chart analysis AI: what to expect
| Crypto detail | How the scan handles it |
|---|---|
| 24/7 market | no session gaps, so daily candles and levels use every hour of trading |
| High volatility | ATR 14 is shown, and stops add half an ATR beyond the nearest level |
| Liquidation wicks | wick highs and lows count as pivot touches, not just closes |
| Altcoin decimals | type prices like 0.000412 exactly, or read levels as % of range |
| Dense exchange charts | grid, text, volume bars and the dashed last-price line are dropped |
| Too few candles | a warning appears under 30 bars, common on brand new listings |
Crypto chart analysis AI FAQ
Can AI analyze crypto charts?
Yes. Upload a screenshot of any coin and the scan reads the candles from the pixels, then shows the trend, levels, RSI, ATR and a setup. It works with exchange apps and TradingView in light or dark themes.
Is there a free AI crypto chart analyzer?
Yes. The chart scan is free and unlimited with no sign-up. The written AI read gives three free runs a day, and credits add more.
Does it work for altcoins and meme coins?
Yes, as long as the chart shows green and red candles and at least 30 bars. For tiny prices, type the high and low with all their decimals.
What timeframe is best for crypto chart analysis?
Any timeframe works, but the 1-hour and 4-hour charts usually show enough bars without too much noise. Daily charts suit swing trades, while 5-minute charts react to every liquidation wick.
Can it predict where a coin will go?
No. It measures trend, levels and patterns with fixed rules, and the confidence score is not a win rate. Treat it as a second opinion, not a signal.