AI chart analysis from a screenshot
AI chart analysis reads a screenshot of a price chart and tells you what the candles show. Upload a PNG or JPG, and in under a second you get the trend, the nearest support and resistance, any clear pattern, and a setup with entry, stop and targets. The scan is free and needs no account.
By The Chartloupe team (Product and testing). Last updated .
PNG, JPG or WebP up to 10 MB. Candlestick or line charts.
Add the price range (optional, gives real prices)
Read the highest and lowest prices touched by the candles on your chart. Without them, levels are shown as a percent of the visible range.
How to get an AI chart analysis, step by step
- Take a screenshot of a candlestick chart in your broker, TradingView or any charting app.
- Drop the image on the box above, paste it with Ctrl+V, or choose the file.
- Optionally, type the highest and lowest price on the chart to get levels in real prices.
- Press Analyze chart and read the trend, levels and setup drawn on your own image.
- Finally, download the annotated PNG or ask for the AI read to get a written explanation.
The chart scan is free and unlimited, and the first 3 AI reads each day are free too. For more, see the pricing page for packs and plans, or read how we test the tool.
AI chart analysis tested on a real chart
We drew this test chart from a price series we know bar by bar, then ran it through this exact analyzer. So the error below is measured against the true prices, not estimated.
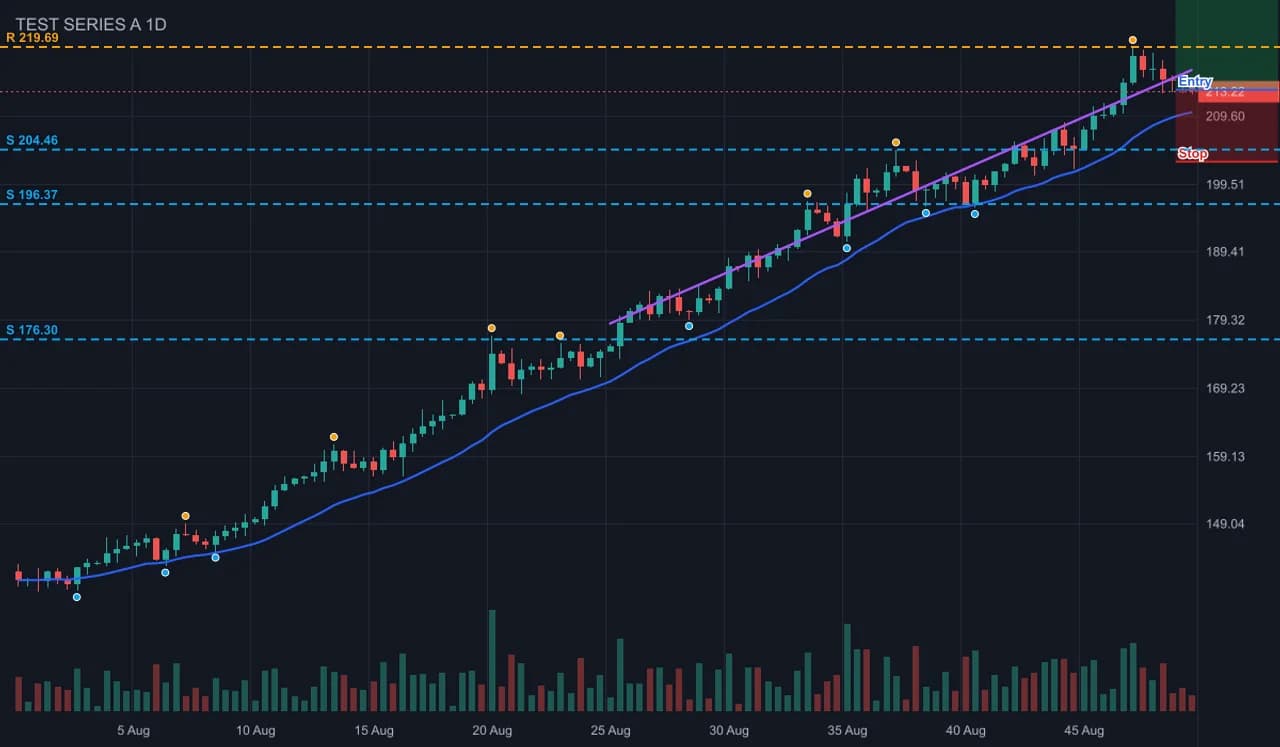
- Test input
- uptrend-stock-dark.png (a stock-like uptrend, dark theme, volume pane and a 20 EMA, drawn from a known price series)
- Output
- Annotated chart with levels, swings and setup
- Bars in the series
- 120
- Bars detected
- 120
- Mean close error
- 0.12% of range
- Worst close error
- 1.93% of range
- Bias
- bullish (+3 of 4 checks)
- RSI 14
- 63.6
- Levels found
- 4
- Setup
- long, reward to risk 2
- Confidence
- 75 of 100
- Annotated PNG size
- 55 KB
- Processing time
- 0.06 s
How we test: every page uses a chart from a known series, and we compare the detected bars with the true ones. More on the about page.
What AI chart analysis finds on your chart
First, the analyzer finds every candle in the image. It separates green and red bodies from the grid, the text and the volume bars, and it turns each candle into open, high, low and close values. On our test charts it finds every bar. On average, the closes land within 0.15 percent of the true range, and the worst bar we have seen was off by 2.4 percent where a moving average line crossed it.
Then it runs four trend checks: the slope of the last 60 closes, the swing structure, a fast and a slow moving average, and where the price sits against the slow average. When three or four checks agree, the chart gets a bullish or bearish bias. Otherwise, it is a range.
After that, it groups swing highs and swing lows that sit close together. Each group becomes a support or resistance level, ranked by the number of touches and how recent they are. As a result, a level with three touches last week ranks above a single old spike.
From the levels to a trade setup
Next, the setup follows the bias. In an uptrend, the long entry is the last price, the stop sits half an average bar below the nearest support, and the targets are the next resistance levels at least one risk unit away. In a downtrend, the same rules run in reverse.
A range is different, because there is no trade yet. Instead, you get two conditional plans: a long only if price closes above resistance, and a short only if it closes below support. Every plan shows its reward to risk, so a setup with a ratio under one is easy to skip.
Why the scan does not guess
Many tools send your picture to a language model and print whatever comes back. In contrast, our scan measures the pixels with fixed rules, so the same chart always gives the same answer. You can also see every level drawn on your own screenshot, which makes each number easy to check.
The optional AI read is the second step. It sends the image and our measured numbers to a vision model, which adds what rules cannot see, such as an RSI panel, the timeframe label or a news marker. So the model explains the chart, but it does not invent the levels.
When AI chart analysis is not the right tool
A screenshot only holds what is visible. For example, it has no order book, no volume profile and no news. Also, a chart with heavy drawings, many overlapping indicators or Heikin Ashi candles can confuse the detector, and the page will warn you when it finds fewer than 30 bars.
Above all, this is an educational tool and not financial advice. Treat the setup as a starting point for your own plan, size positions with care, and never trade money you cannot afford to lose.
What the AI chart analysis reports
| Output | How it is measured |
|---|---|
| Bias | four trend checks: slope, swing structure, EMA cross, price against the slow EMA |
| Support and resistance | clusters of swing highs and lows, ranked by touches and recency |
| RSI 14 | Wilder RSI on the detected closes (exact even without the price axis) |
| Setup | entry, stop behind the nearest level plus half an ATR, targets at least 1R away, reward to risk |
| Patterns | double top and bottom, breakouts, squeezes, engulfing, hammer, doji, RSI divergence |
| Speed | under one second for a 1400 pixel wide screenshot on our server |
AI chart analysis FAQ
Can AI analyze a stock chart from a picture?
Yes. Upload a screenshot and the analyzer reads the candles from the pixels, then reports the trend, levels, patterns and a setup. It works for stocks, crypto, forex and futures charts.
Is this AI chart analysis free?
Yes. The chart scan is free and unlimited, with no account. The written AI read has three free runs a day, and packs or plans add more.
How accurate is AI chart analysis?
Detection is measured: on our test charts drawn from known prices, it finds every bar, and the closes land within 0.15 percent of the range on average. The bias and setup are rules, not predictions, so no tool can promise the next move.
Which chart apps does it work with?
Any app that draws green and red candles or a colored price line, such as TradingView, broker platforms, Yahoo Finance or exchange apps. Light and dark themes both work.
Do you keep my screenshot?
No. The image stays in memory while it is analyzed and is dropped when the result is sent back. We only log that a scan ran and how long it took.
Why do I need to type the highest and lowest price?
The analyzer does not read the axis text yet. With those two prices it turns every level into a real price; without them, levels show as a percent of the visible range.